29
/es/
es
AIzaSyAYiBZKx7MnpbEhh9jyipgxe19OcubqV5w
April 1, 2024
137130
Gambia, The
GMB
true
2
1
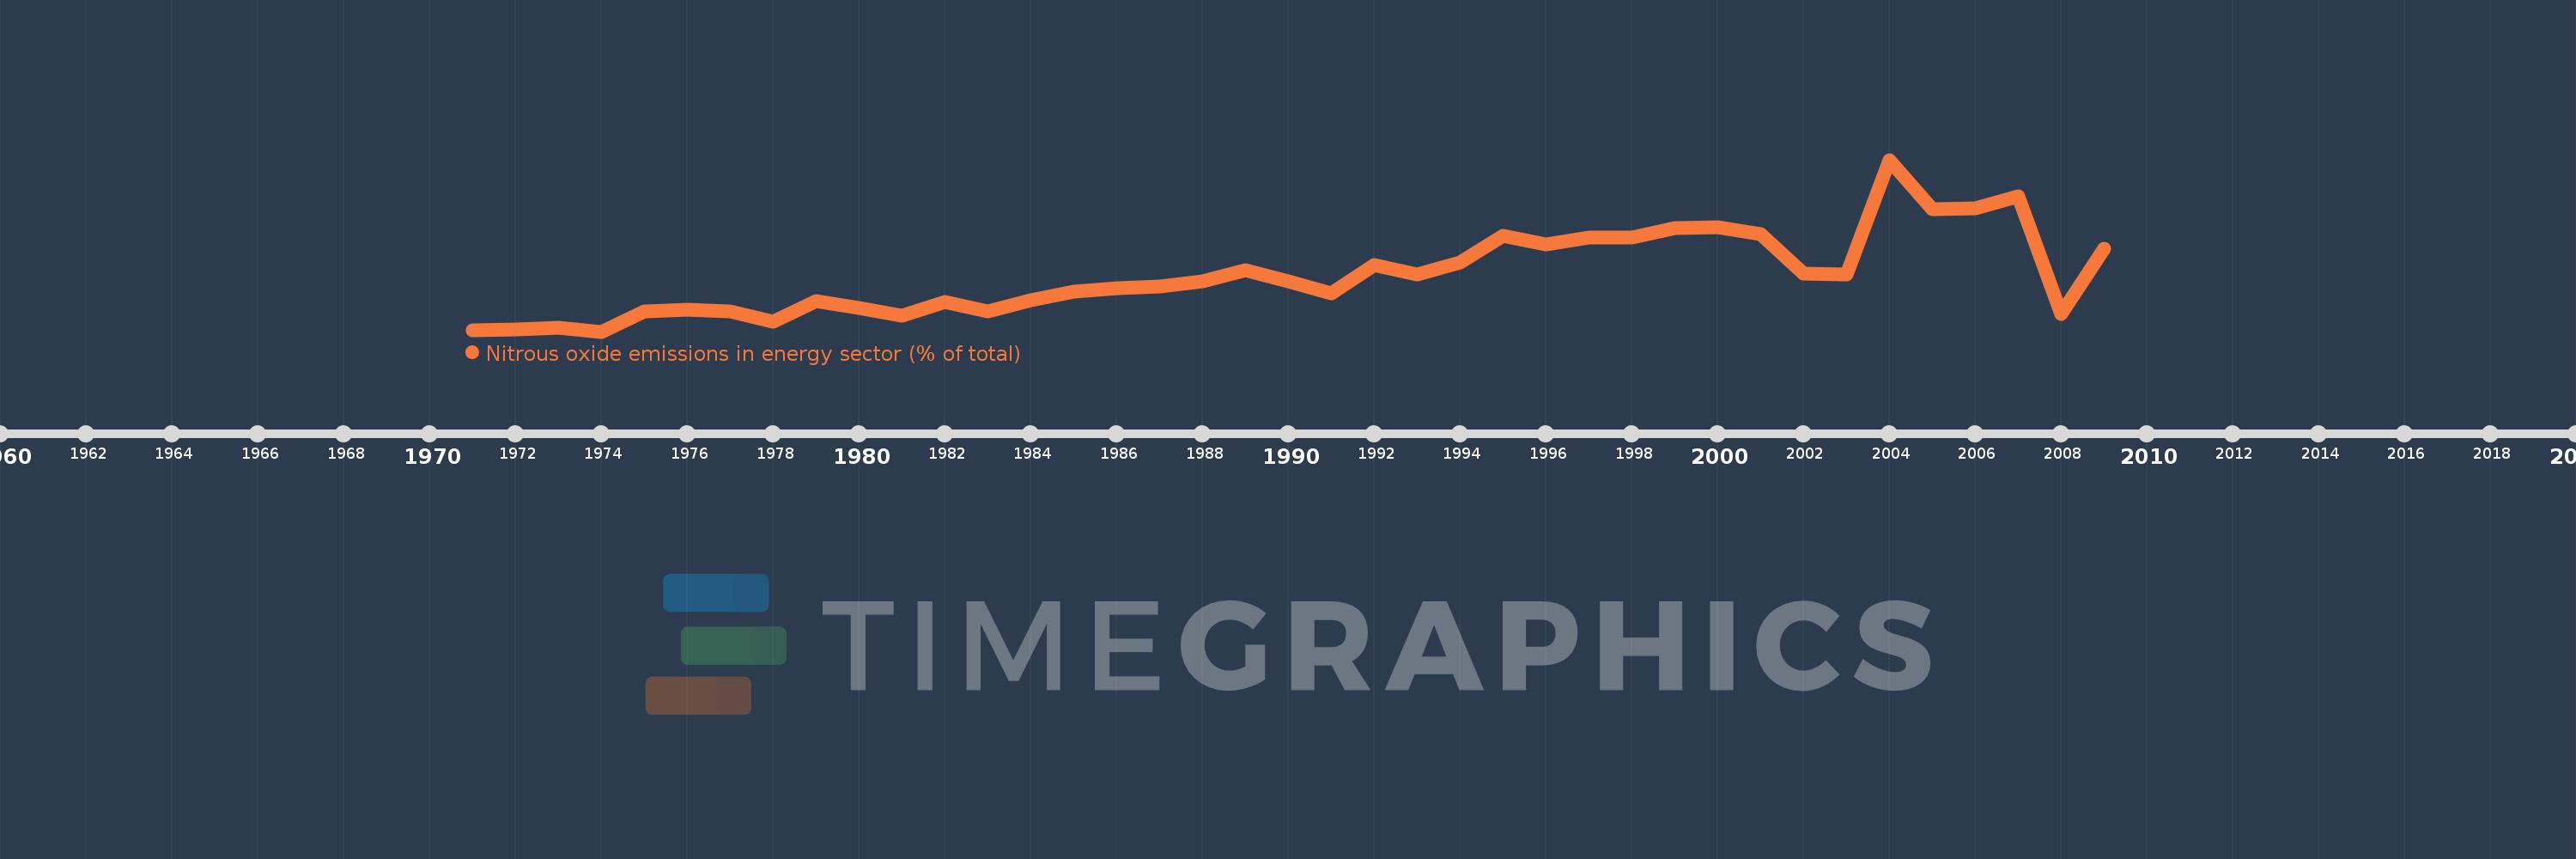
Nitrous oxide emissions in energy sector (% of total)
2009,2008,2007,2006,2005,2004,2003,2002,2001,2000,1999,1998,1997,1996,1995,1994,1993,1992,1991,1990,1989,1988,1987,1986,1985,1984,1983,1982,1981,1980,1979,1978,1977,1976,1975,1974,1973,1972,1971
Estas estadísticas en otros países:
AfghanistanAlbaniaAlgeriaAmerican SamoaAndorraAngolaAntigua and BarbudaArab WorldArgentinaArmeniaArubaAustraliaAustriaAzerbaijanBahamas, TheBahrainBangladeshBarbadosBelarusBelgiumBelizeBeninBermudaBhutanBoliviaBosnia and HerzegovinaBotswanaBrazilBritish Virgin IslandsBrunei DarussalamBulgariaBurkina FasoBurundiCabo VerdeCambodiaCameroonCanadaCaribbean small statesCayman IslandsCentral African RepublicCentral Europe and the BalticsChadChileChinaColombiaComorosCongo, Dem. Rep.Congo, Rep.Costa RicaCote d'IvoireCroatiaCubaCyprusCzech RepublicDenmarkDjiboutiDominicaDominican RepublicEarly-demographic dividendEast Asia & PacificEast Asia & Pacific (excluding high income)East Asia & Pacific (IDA & IBRD countries)EcuadorEgypt, Arab Rep.El SalvadorEquatorial GuineaEritreaEstoniaEthiopiaEuro areaEurope & Central AsiaEurope & Central Asia (excluding high income)Europe & Central Asia (IDA & IBRD countries)European UnionFaroe IslandsFijiFinlandFragile and conflict affected situationsFranceFrench PolynesiaGabonGambia, TheGeorgiaGermanyGhanaGibraltarGreeceGreenlandGrenadaGuamGuatemalaGuineaGuinea-BissauGuyanaHaitiHeavily indebted poor countries (HIPC)High incomeHondurasHong Kong SAR, ChinaHungaryIBRD onlyIcelandIDA & IBRD totalIDA blendIDA onlyIDA totalIndiaIndonesiaIran, Islamic Rep.IraqIrelandIsraelItalyJamaicaJapanJordanKazakhstanKenyaKiribatiKorea, Dem. People’s Rep.Korea, Rep.KuwaitKyrgyz RepublicLao PDRLate-demographic dividendLatin America & Caribbean Latin America & Caribbean (excluding high income)Latin America & the Caribbean (IDA & IBRD countries)LatviaLeast developed countries: UN classificationLebanonLesothoLiberiaLibyaLithuaniaLow & middle incomeLow incomeLower middle incomeLuxembourgMacao SAR, ChinaMacedonia, FYRMadagascarMalawiMalaysiaMaldivesMaliMaltaMarshall IslandsMauritaniaMauritiusMexicoMicronesia, Fed. Sts.Middle East & North AfricaMiddle East & North Africa (excluding high income)Middle East & North Africa (IDA & IBRD countries)Middle incomeMoldovaMongoliaMoroccoMozambiqueMyanmarNamibiaNauruNepalNetherlandsNew CaledoniaNew ZealandNicaraguaNigerNigeriaNorth AmericaNorthern Mariana IslandsNorwayOECD membersOmanOther small statesPacific island small statesPakistanPalauPanamaPapua New GuineaParaguayPeruPhilippinesPolandPortugalPost-demographic dividendPre-demographic dividendPuerto RicoQatarRomaniaRussian FederationRwandaSamoaSao Tome and PrincipeSaudi ArabiaSenegalSerbiaSeychellesSierra LeoneSingaporeSlovak RepublicSloveniaSmall statesSolomon IslandsSomaliaSouth AfricaSouth AsiaSouth Asia (IDA & IBRD)SpainSri LankaSt. Kitts and NevisSt. LuciaSt. Vincent and the GrenadinesSub-Saharan Africa Sub-Saharan Africa (excluding high income)Sub-Saharan Africa (IDA & IBRD countries)SudanSurinameSwazilandSwedenSwitzerlandSyrian Arab RepublicTajikistanTanzaniaThailandTimor-LesteTogoTongaTrinidad and TobagoTunisiaTurkeyTurkmenistanTurks and Caicos IslandsTuvaluUgandaUkraineUnited Arab EmiratesUnited KingdomUnited StatesUpper middle incomeUruguayUzbekistanVanuatuVenezuela, RBVietnamVirgin Islands (U.S.)WorldYemen, Rep.ZambiaZimbabwe línea de tiempo (timeline):
En esta escala de tiempo se presenta un gráfico de 1971 y 2009 de Gambia, The. Los datos de 1970 están ausentes. El número de observaciones reales por fecha: 39.
Fuente (nombre):
Indicadores del desarrollo mundial
Fuente (organización):
World Bank staff estimates from original source: European Commission, Joint Research Centre (JRC)/Netherlands Environmental Assessment Agency (PBL). Emission Database for Global Atmospheric Research (EDGAR): http://edgar.jrc.ec.europa.eu/.
Categorías:
Energy & Mining, Environment
Se ha actualizado:
23 abr 2017 año
Los indicadores de los cambios de valor en los últimos años
Mínimo:
2.241
1 ene 1974 año
Máximo:
5.675
1 ene 2004 año
A la fecha de observación
Valor
Cambio absoluto
El cambio con respecto al valor anterior
1 ene 1971 año
2.266
+2.266
0.0%
1 ene 1972 año
2.286
+0.021
0.91%
1 ene 1973 año
2.313
+0.026
1.16%
1 ene 1974 año
2.241
-0.071
-3.09%
1 ene 1975 año
2.644
+0.402
17.95%
1 ene 1976 año
2.675
+0.032
1.19%
1 ene 1977 año
2.64
-0.036
-1.33%
1 ene 1978 año
2.439
-0.201
-7.61%
1 ene 1979 año
2.844
+0.405
16.62%
1 ene 1980 año
2.714
-0.131
-4.6%
1 ene 1981 año
2.556
-0.158
-5.82%
1 ene 1982 año
2.825
+0.269
10.54%
1 ene 1983 año
2.644
-0.181
-6.41%
1 ene 1984 año
2.874
+0.23
8.7%
1 ene 1985 año
3.04
+0.166
5.78%
1 ene 1986 año
3.105
+0.065
2.15%
1 ene 1987 año
3.144
+0.039
1.25%
1 ene 1988 año
3.253
+0.109
3.45%
1 ene 1989 año
3.473
+0.221
6.78%
1 ene 1990 año
3.249
-0.224
-6.46%
1 ene 1991 año
3.013
-0.235
-7.24%
1 ene 1992 año
3.57
+0.557
18.48%
1 ene 1993 año
3.385
-0.185
-5.17%
1 ene 1994 año
3.631
+0.246
7.27%
1 ene 1995 año
4.148
+0.516
14.22%
1 ene 1996 año
3.992
-0.156
-3.76%
1 ene 1997 año
4.122
+0.13
3.26%
1 ene 1998 año
4.124
+0.002
0.04%
1 ene 1999 año
4.311
+0.187
4.54%
1 ene 2000 año
4.32
+0.008
0.19%
1 ene 2001 año
4.192
-0.127
-2.95%
1 ene 2002 año
3.401
-0.791
-18.87%
1 ene 2003 año
3.376
-0.025
-0.73%
1 ene 2004 año
5.675
+2.299
68.08%
1 ene 2005 año
4.696
-0.979
-17.25%
1 ene 2006 año
4.702
+0.006
0.13%
1 ene 2007 año
4.94
+0.237
5.05%
1 ene 2008 año
2.593
-2.347
-47.51%
1 ene 2009 año
3.901
+1.308
50.43%
Ranking de los países por los datos estadísticos actuales


Comentarios: