29
/es/
es
AIzaSyAYiBZKx7MnpbEhh9jyipgxe19OcubqV5w
April 1, 2024
196885
Micronesia, Fed. Sts.
FSM
true
2
1
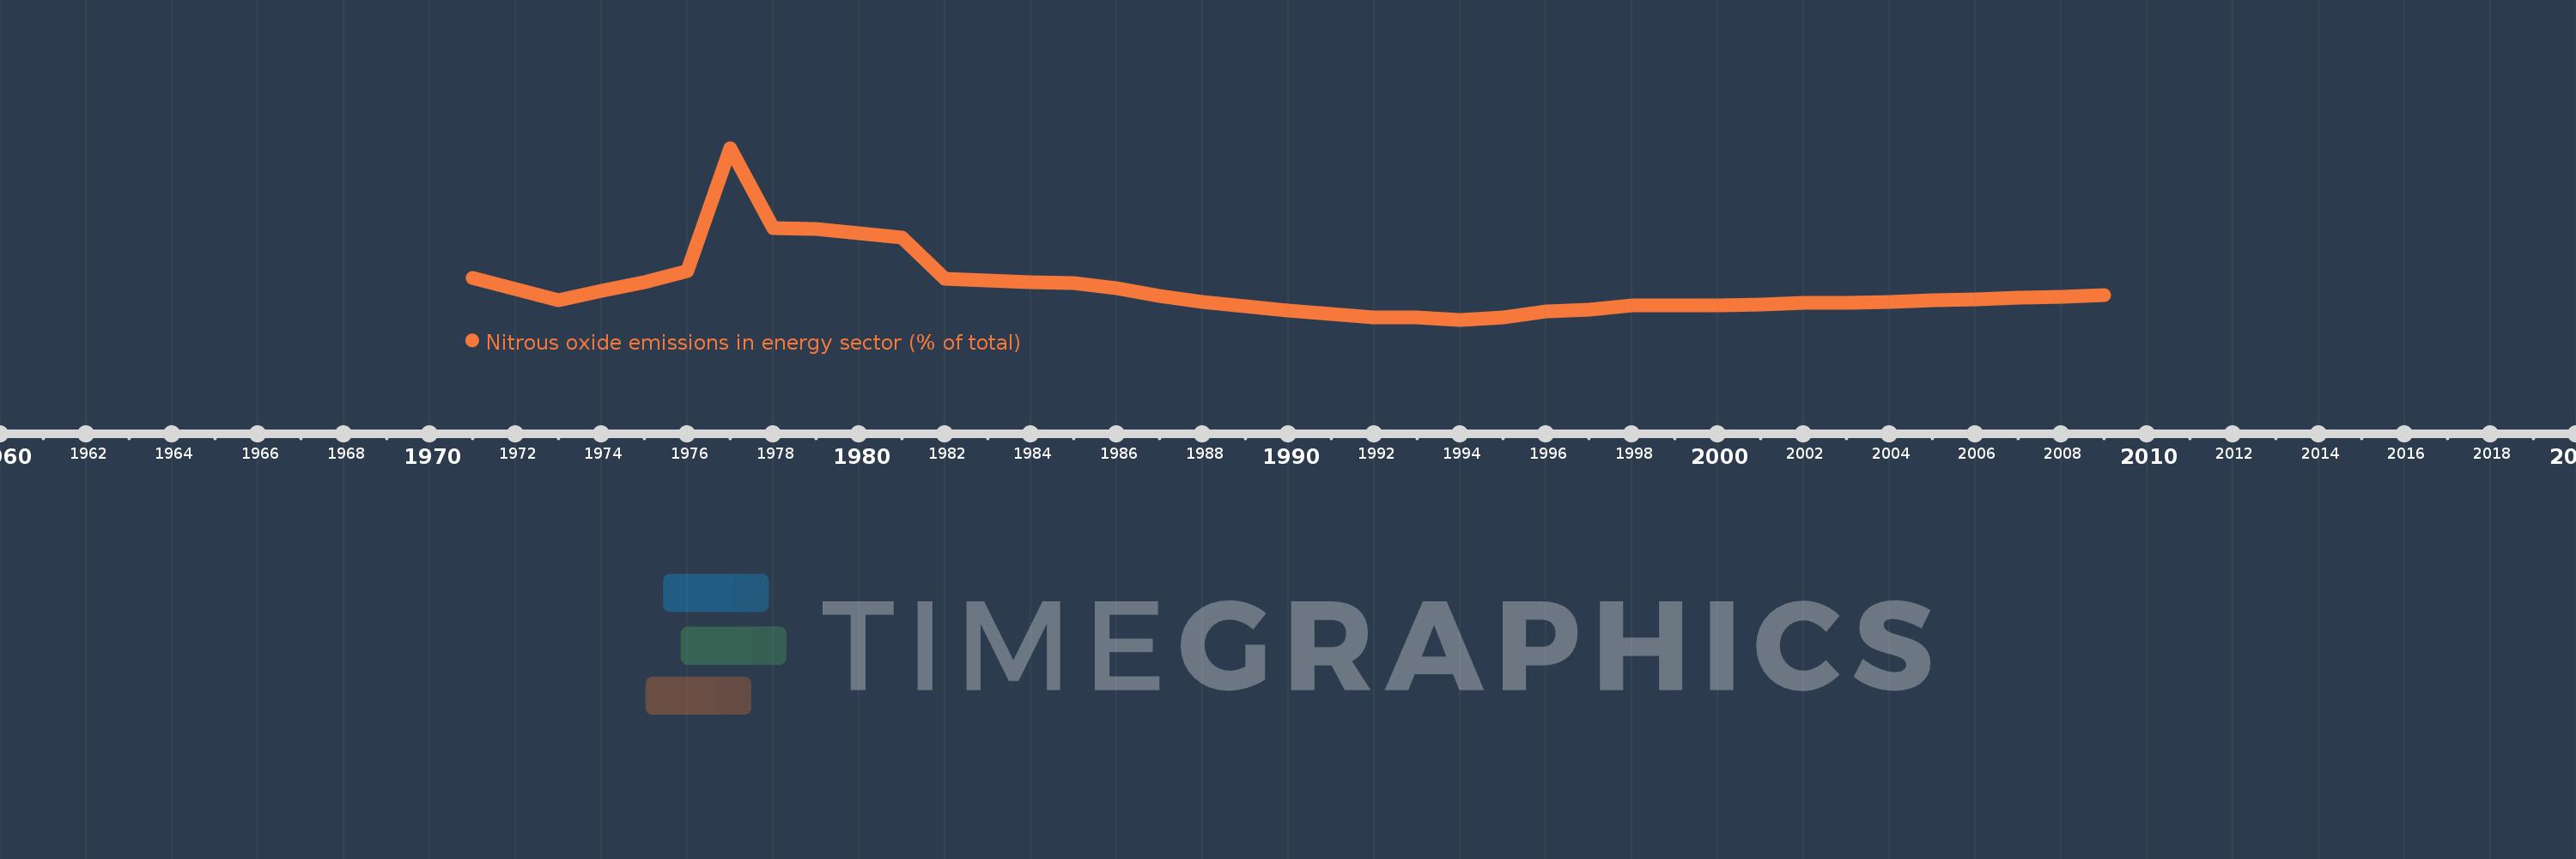
Nitrous oxide emissions in energy sector (% of total)
2009,2008,2007,2006,2005,2004,2003,2002,2001,2000,1999,1998,1997,1996,1995,1994,1993,1992,1991,1990,1989,1988,1987,1986,1985,1984,1983,1982,1981,1980,1979,1978,1977,1976,1975,1974,1973,1972,1971
Estas estadísticas en otros países:
AfghanistanAlbaniaAlgeriaAmerican SamoaAndorraAngolaAntigua and BarbudaArab WorldArgentinaArmeniaArubaAustraliaAustriaAzerbaijanBahamas, TheBahrainBangladeshBarbadosBelarusBelgiumBelizeBeninBermudaBhutanBoliviaBosnia and HerzegovinaBotswanaBrazilBritish Virgin IslandsBrunei DarussalamBulgariaBurkina FasoBurundiCabo VerdeCambodiaCameroonCanadaCaribbean small statesCayman IslandsCentral African RepublicCentral Europe and the BalticsChadChileChinaColombiaComorosCongo, Dem. Rep.Congo, Rep.Costa RicaCote d'IvoireCroatiaCubaCyprusCzech RepublicDenmarkDjiboutiDominicaDominican RepublicEarly-demographic dividendEast Asia & PacificEast Asia & Pacific (excluding high income)East Asia & Pacific (IDA & IBRD countries)EcuadorEgypt, Arab Rep.El SalvadorEquatorial GuineaEritreaEstoniaEthiopiaEuro areaEurope & Central AsiaEurope & Central Asia (excluding high income)Europe & Central Asia (IDA & IBRD countries)European UnionFaroe IslandsFijiFinlandFragile and conflict affected situationsFranceFrench PolynesiaGabonGambia, TheGeorgiaGermanyGhanaGibraltarGreeceGreenlandGrenadaGuamGuatemalaGuineaGuinea-BissauGuyanaHaitiHeavily indebted poor countries (HIPC)High incomeHondurasHong Kong SAR, ChinaHungaryIBRD onlyIcelandIDA & IBRD totalIDA blendIDA onlyIDA totalIndiaIndonesiaIran, Islamic Rep.IraqIrelandIsraelItalyJamaicaJapanJordanKazakhstanKenyaKiribatiKorea, Dem. People’s Rep.Korea, Rep.KuwaitKyrgyz RepublicLao PDRLate-demographic dividendLatin America & Caribbean Latin America & Caribbean (excluding high income)Latin America & the Caribbean (IDA & IBRD countries)LatviaLeast developed countries: UN classificationLebanonLesothoLiberiaLibyaLithuaniaLow & middle incomeLow incomeLower middle incomeLuxembourgMacao SAR, ChinaMacedonia, FYRMadagascarMalawiMalaysiaMaldivesMaliMaltaMarshall IslandsMauritaniaMauritiusMexicoMicronesia, Fed. Sts.Middle East & North AfricaMiddle East & North Africa (excluding high income)Middle East & North Africa (IDA & IBRD countries)Middle incomeMoldovaMongoliaMoroccoMozambiqueMyanmarNamibiaNauruNepalNetherlandsNew CaledoniaNew ZealandNicaraguaNigerNigeriaNorth AmericaNorthern Mariana IslandsNorwayOECD membersOmanOther small statesPacific island small statesPakistanPalauPanamaPapua New GuineaParaguayPeruPhilippinesPolandPortugalPost-demographic dividendPre-demographic dividendPuerto RicoQatarRomaniaRussian FederationRwandaSamoaSao Tome and PrincipeSaudi ArabiaSenegalSerbiaSeychellesSierra LeoneSingaporeSlovak RepublicSloveniaSmall statesSolomon IslandsSomaliaSouth AfricaSouth AsiaSouth Asia (IDA & IBRD)SpainSri LankaSt. Kitts and NevisSt. LuciaSt. Vincent and the GrenadinesSub-Saharan Africa Sub-Saharan Africa (excluding high income)Sub-Saharan Africa (IDA & IBRD countries)SudanSurinameSwazilandSwedenSwitzerlandSyrian Arab RepublicTajikistanTanzaniaThailandTimor-LesteTogoTongaTrinidad and TobagoTunisiaTurkeyTurkmenistanTurks and Caicos IslandsTuvaluUgandaUkraineUnited Arab EmiratesUnited KingdomUnited StatesUpper middle incomeUruguayUzbekistanVanuatuVenezuela, RBVietnamVirgin Islands (U.S.)WorldYemen, Rep.ZambiaZimbabwe línea de tiempo (timeline):
En esta escala de tiempo se presenta un gráfico de 1971 y 2009 de Micronesia, Fed. Sts.. Los datos de 1970 están ausentes. El número de observaciones reales por fecha: 39.
Fuente (nombre):
Indicadores del desarrollo mundial
Fuente (organización):
World Bank staff estimates from original source: European Commission, Joint Research Centre (JRC)/Netherlands Environmental Assessment Agency (PBL). Emission Database for Global Atmospheric Research (EDGAR): http://edgar.jrc.ec.europa.eu/.
Categorías:
Energy & Mining, Environment
Se ha actualizado:
23 abr 2017 año
Los indicadores de los cambios de valor en los últimos años
Mínimo:
0.131
1 ene 1994 año
Máximo:
0.389
1 ene 1977 año
A la fecha de observación
Valor
Cambio absoluto
El cambio con respecto al valor anterior
1 ene 1971 año
0.194
+0.194
0.0%
1 ene 1972 año
0.177
-0.017
-8.86%
1 ene 1973 año
0.16
-0.017
-9.53%
1 ene 1974 año
0.174
+0.014
8.65%
1 ene 1975 año
0.188
+0.014
7.84%
1 ene 1976 año
0.204
+0.016
8.65%
1 ene 1977 año
0.389
+0.185
90.85%
1 ene 1978 año
0.269
-0.12
-30.77%
1 ene 1979 año
0.267
-0.002
-0.66%
1 ene 1980 año
0.261
-0.006
-2.26%
1 ene 1981 año
0.255
-0.006
-2.26%
1 ene 1982 año
0.192
-0.063
-24.74%
1 ene 1983 año
0.19
-0.002
-0.99%
1 ene 1984 año
0.188
-0.002
-1.01%
1 ene 1985 año
0.186
-0.002
-1.03%
1 ene 1986 año
0.178
-0.009
-4.65%
1 ene 1987 año
0.167
-0.011
-6.21%
1 ene 1988 año
0.158
-0.009
-5.15%
1 ene 1989 año
0.151
-0.007
-4.22%
1 ene 1990 año
0.145
-0.006
-4.13%
1 ene 1991 año
0.139
-0.006
-4.04%
1 ene 1992 año
0.135
-0.004
-3.03%
1 ene 1993 año
0.135
-0.001
-0.42%
1 ene 1994 año
0.131
-0.004
-2.87%
1 ene 1995 año
0.134
+0.004
2.89%
1 ene 1996 año
0.143
+0.009
6.48%
1 ene 1997 año
0.146
+0.003
2.0%
1 ene 1998 año
0.152
+0.006
4.03%
1 ene 1999 año
0.152
0.0
-0.2%
1 ene 2000 año
0.153
+0.002
1.02%
1 ene 2001 año
0.154
+0.0
0.26%
1 ene 2002 año
0.156
+0.002
1.37%
1 ene 2003 año
0.157
+0.001
0.72%
1 ene 2004 año
0.158
+0.001
0.79%
1 ene 2005 año
0.16
+0.002
1.29%
1 ene 2006 año
0.162
+0.002
1.08%
1 ene 2007 año
0.164
+0.002
1.34%
1 ene 2008 año
0.166
+0.002
1.15%
1 ene 2009 año
0.168
+0.002
1.3%
Ranking de los países por los datos estadísticos actuales


Comentarios: