29
/es/
es
AIzaSyAYiBZKx7MnpbEhh9jyipgxe19OcubqV5w
April 1, 2024
55291
Pre-demographic dividend
PRE
false
2
1
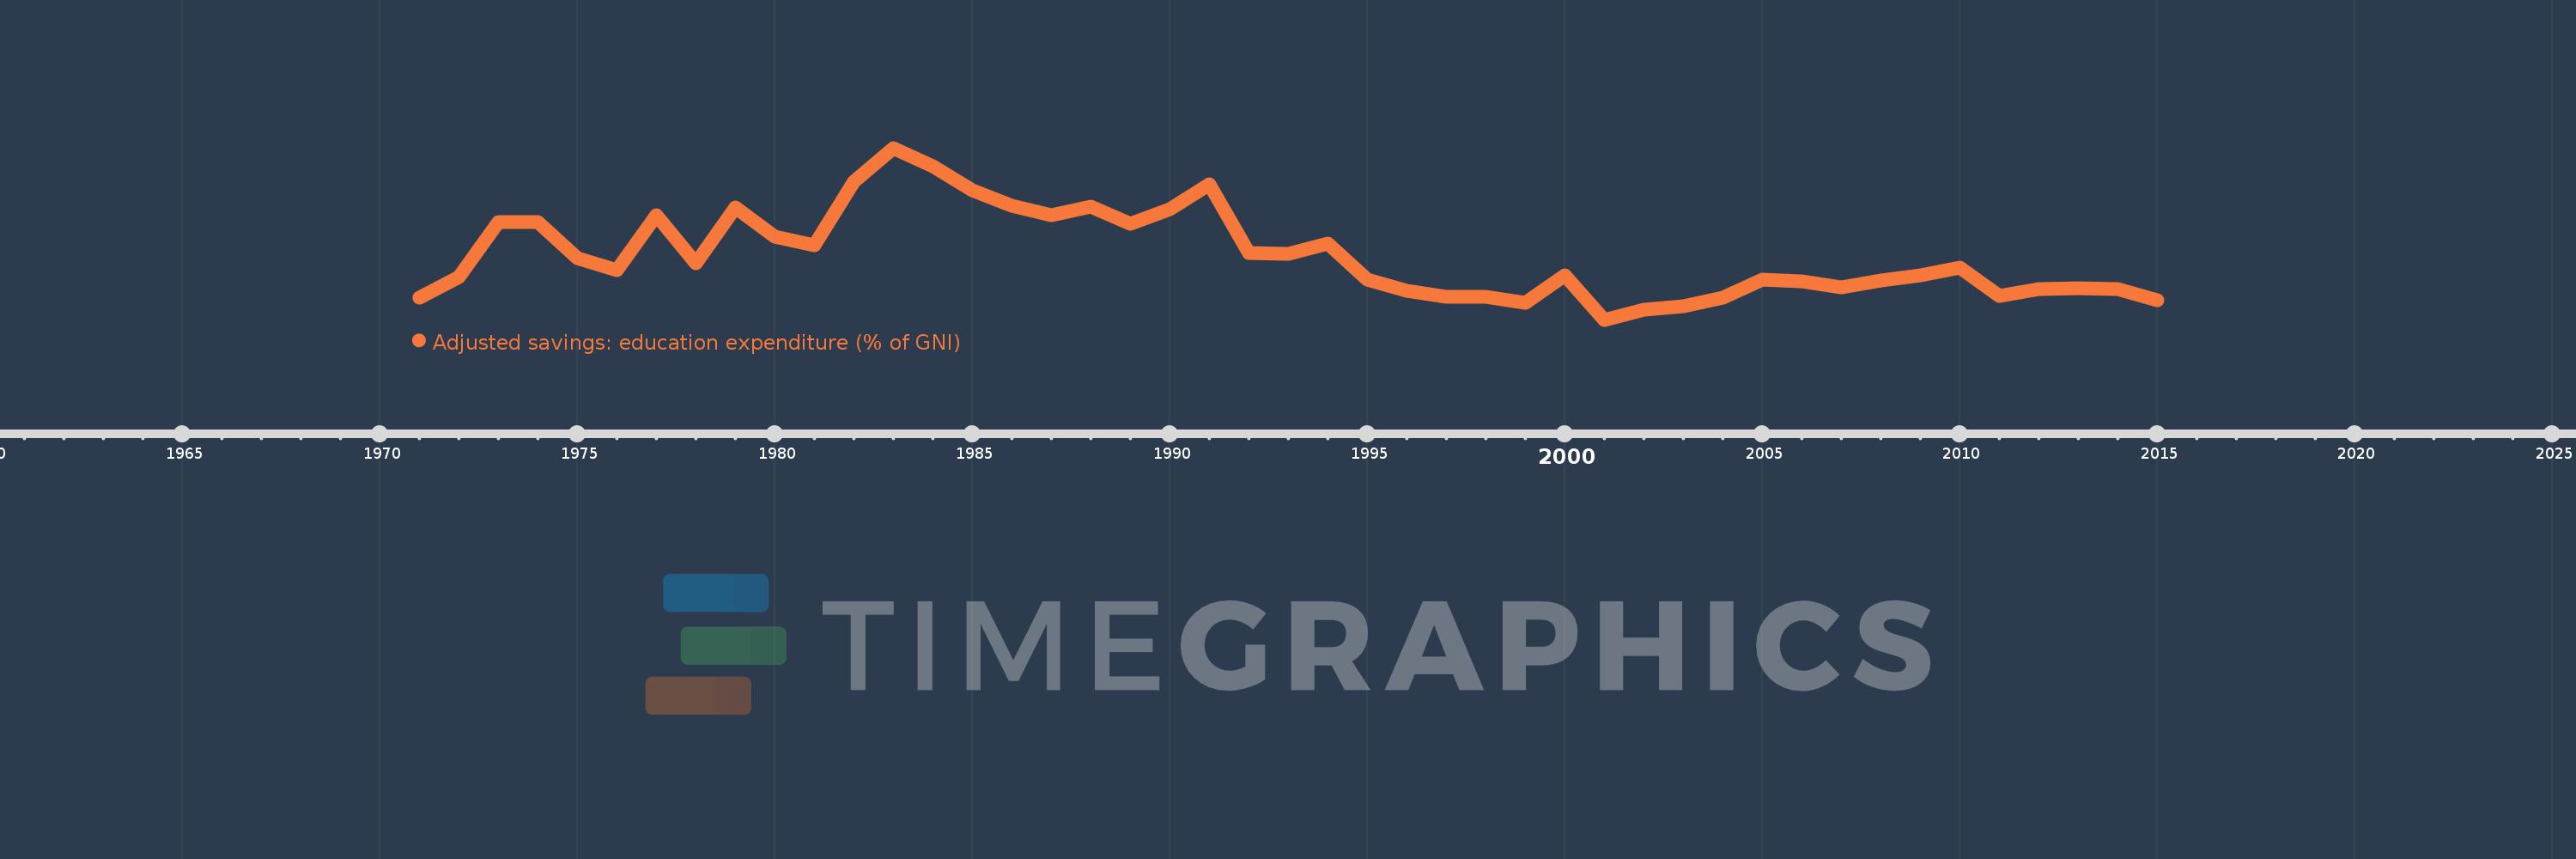
Adjusted savings: education expenditure (% of GNI)
2015,2014,2013,2012,2011,2010,2009,2008,2007,2006,2005,2004,2003,2002,2001,2000,1999,1998,1997,1996,1995,1994,1993,1992,1991,1990,1989,1988,1987,1986,1985,1984,1983,1982,1981,1980,1979,1978,1977,1976,1975,1974,1973,1972,1971
Estas estadísticas en otros países:
AfghanistanAlbaniaAlgeriaAmerican SamoaAndorraAngolaAntigua and BarbudaArab WorldArgentinaArmeniaAustraliaAustriaAzerbaijanBahamas, TheBahrainBangladeshBarbadosBelarusBelgiumBelizeBeninBermudaBhutanBoliviaBotswanaBrazilBrunei DarussalamBulgariaBurkina FasoBurundiCabo VerdeCambodiaCameroonCanadaCaribbean small statesCentral African RepublicCentral Europe and the BalticsChadChileChinaColombiaComorosCongo, Dem. Rep.Congo, Rep.Costa RicaCote d'IvoireCroatiaCubaCyprusCzech RepublicDenmarkDjiboutiDominicaDominican RepublicEarly-demographic dividendEast Asia & PacificEast Asia & Pacific (excluding high income)East Asia & Pacific (IDA & IBRD countries)EcuadorEgypt, Arab Rep.El SalvadorEquatorial GuineaEritreaEstoniaEthiopiaEuro areaEurope & Central AsiaEurope & Central Asia (excluding high income)Europe & Central Asia (IDA & IBRD countries)European UnionFijiFinlandFragile and conflict affected situationsFranceFrench PolynesiaGabonGambia, TheGeorgiaGermanyGhanaGreeceGrenadaGuatemalaGuineaGuinea-BissauGuyanaHaitiHeavily indebted poor countries (HIPC)High incomeHondurasHong Kong SAR, ChinaHungaryIBRD onlyIcelandIDA & IBRD totalIDA blendIDA onlyIDA totalIndiaIndonesiaIran, Islamic Rep.IraqIrelandIsraelItalyJamaicaJapanJordanKazakhstanKenyaKiribatiKorea, Rep.KuwaitKyrgyz RepublicLao PDRLate-demographic dividendLatin America & Caribbean Latin America & Caribbean (excluding high income)Latin America & the Caribbean (IDA & IBRD countries)LatviaLeast developed countries: UN classificationLebanonLesothoLiberiaLibyaLiechtensteinLithuaniaLow & middle incomeLow incomeLower middle incomeLuxembourgMacao SAR, ChinaMacedonia, FYRMadagascarMalawiMalaysiaMaldivesMaliMaltaMarshall IslandsMauritaniaMauritiusMexicoMicronesia, Fed. Sts.Middle East & North AfricaMiddle East & North Africa (excluding high income)Middle East & North Africa (IDA & IBRD countries)Middle incomeMoldovaMonacoMongoliaMoroccoMozambiqueMyanmarNamibiaNepalNetherlandsNew CaledoniaNew ZealandNicaraguaNigerNigeriaNorth AmericaNorwayOECD membersOmanOther small statesPacific island small statesPakistanPanamaPapua New GuineaParaguayPeruPhilippinesPolandPortugalPost-demographic dividendPre-demographic dividendPuerto RicoQatarRomaniaRussian FederationRwandaSamoaSan MarinoSao Tome and PrincipeSaudi ArabiaSenegalSerbiaSeychellesSierra LeoneSingaporeSlovak RepublicSloveniaSmall statesSolomon IslandsSomaliaSouth AfricaSouth AsiaSouth Asia (IDA & IBRD)SpainSri LankaSt. Kitts and NevisSt. LuciaSt. Vincent and the GrenadinesSub-Saharan Africa Sub-Saharan Africa (excluding high income)Sub-Saharan Africa (IDA & IBRD countries)SudanSurinameSwazilandSwedenSwitzerlandSyrian Arab RepublicTajikistanTanzaniaThailandTimor-LesteTogoTongaTrinidad and TobagoTunisiaTurkeyTurkmenistanUgandaUkraineUnited KingdomUnited StatesUpper middle incomeUruguayUzbekistanVanuatuVenezuela, RBVietnamVirgin Islands (U.S.)WorldYemen, Rep.ZambiaZimbabwe línea de tiempo (timeline):
En esta escala de tiempo se presenta un gráfico de 1971 y 2015 de Pre-demographic dividend. Los datos de 1970 están ausentes. El número de observaciones reales por fecha: 45.
Fuente (nombre):
Indicadores del desarrollo mundial
Fuente (organización):
World Bank staff estimates using data from the United Nations Statistics Division's Statistical Yearbook, and the UNESCO Institute for Statistics online database.
Categorías:
Economy & Growth, Environment
Se ha actualizado:
23 abr 2017 año
Los indicadores de los cambios de valor en los últimos años
Mínimo:
2.175
1 ene 2001 año
Máximo:
4.479
1 ene 1983 año
A la fecha de observación
Valor
Cambio absoluto
El cambio con respecto al valor anterior
1 ene 1971 año
2.468
+2.468
0.0%
1 ene 1972 año
2.746
+0.278
11.25%
1 ene 1973 año
3.484
+0.738
26.87%
1 ene 1974 año
3.482
-0.002
-0.05%
1 ene 1975 año
3.006
-0.476
-13.66%
1 ene 1976 año
2.834
-0.172
-5.72%
1 ene 1977 año
3.578
+0.743
26.22%
1 ene 1978 año
2.935
-0.643
-17.98%
1 ene 1979 año
3.677
+0.742
25.29%
1 ene 1980 año
3.285
-0.391
-10.64%
1 ene 1981 año
3.174
-0.111
-3.39%
1 ene 1982 año
4.029
+0.855
26.94%
1 ene 1983 año
4.479
+0.45
11.17%
1 ene 1984 año
4.234
-0.245
-5.47%
1 ene 1985 año
3.913
-0.321
-7.58%
1 ene 1986 año
3.701
-0.212
-5.42%
1 ene 1987 año
3.578
-0.123
-3.34%
1 ene 1988 año
3.688
+0.11
3.09%
1 ene 1989 año
3.457
-0.231
-6.27%
1 ene 1990 año
3.661
+0.205
5.93%
1 ene 1991 año
3.994
+0.332
9.07%
1 ene 1992 año
3.069
-0.924
-23.15%
1 ene 1993 año
3.053
-0.017
-0.54%
1 ene 1994 año
3.192
+0.14
4.58%
1 ene 1995 año
2.716
-0.476
-14.91%
1 ene 1996 año
2.566
-0.15
-5.52%
1 ene 1997 año
2.487
-0.079
-3.08%
1 ene 1998 año
2.482
-0.006
-0.23%
1 ene 1999 año
2.403
-0.079
-3.17%
1 ene 2000 año
2.767
+0.364
15.15%
1 ene 2001 año
2.175
-0.592
-21.4%
1 ene 2002 año
2.305
+0.13
5.97%
1 ene 2003 año
2.357
+0.052
2.27%
1 ene 2004 año
2.467
+0.11
4.68%
1 ene 2005 año
2.709
+0.242
9.79%
1 ene 2006 año
2.688
-0.021
-0.76%
1 ene 2007 año
2.614
-0.074
-2.76%
1 ene 2008 año
2.696
+0.082
3.15%
1 ene 2009 año
2.766
+0.069
2.57%
1 ene 2010 año
2.876
+0.11
4.0%
1 ene 2011 año
2.499
-0.377
-13.1%
1 ene 2012 año
2.589
+0.09
3.6%
1 ene 2013 año
2.595
+0.006
0.23%
1 ene 2014 año
2.585
-0.01
-0.39%
1 ene 2015 año
2.442
-0.143
-5.55%
Ranking de los países por los datos estadísticos actuales


Comentarios: