29
/es/
es
AIzaSyAYiBZKx7MnpbEhh9jyipgxe19OcubqV5w
April 1, 2024
53187
Other small states
OSS
false
2
1
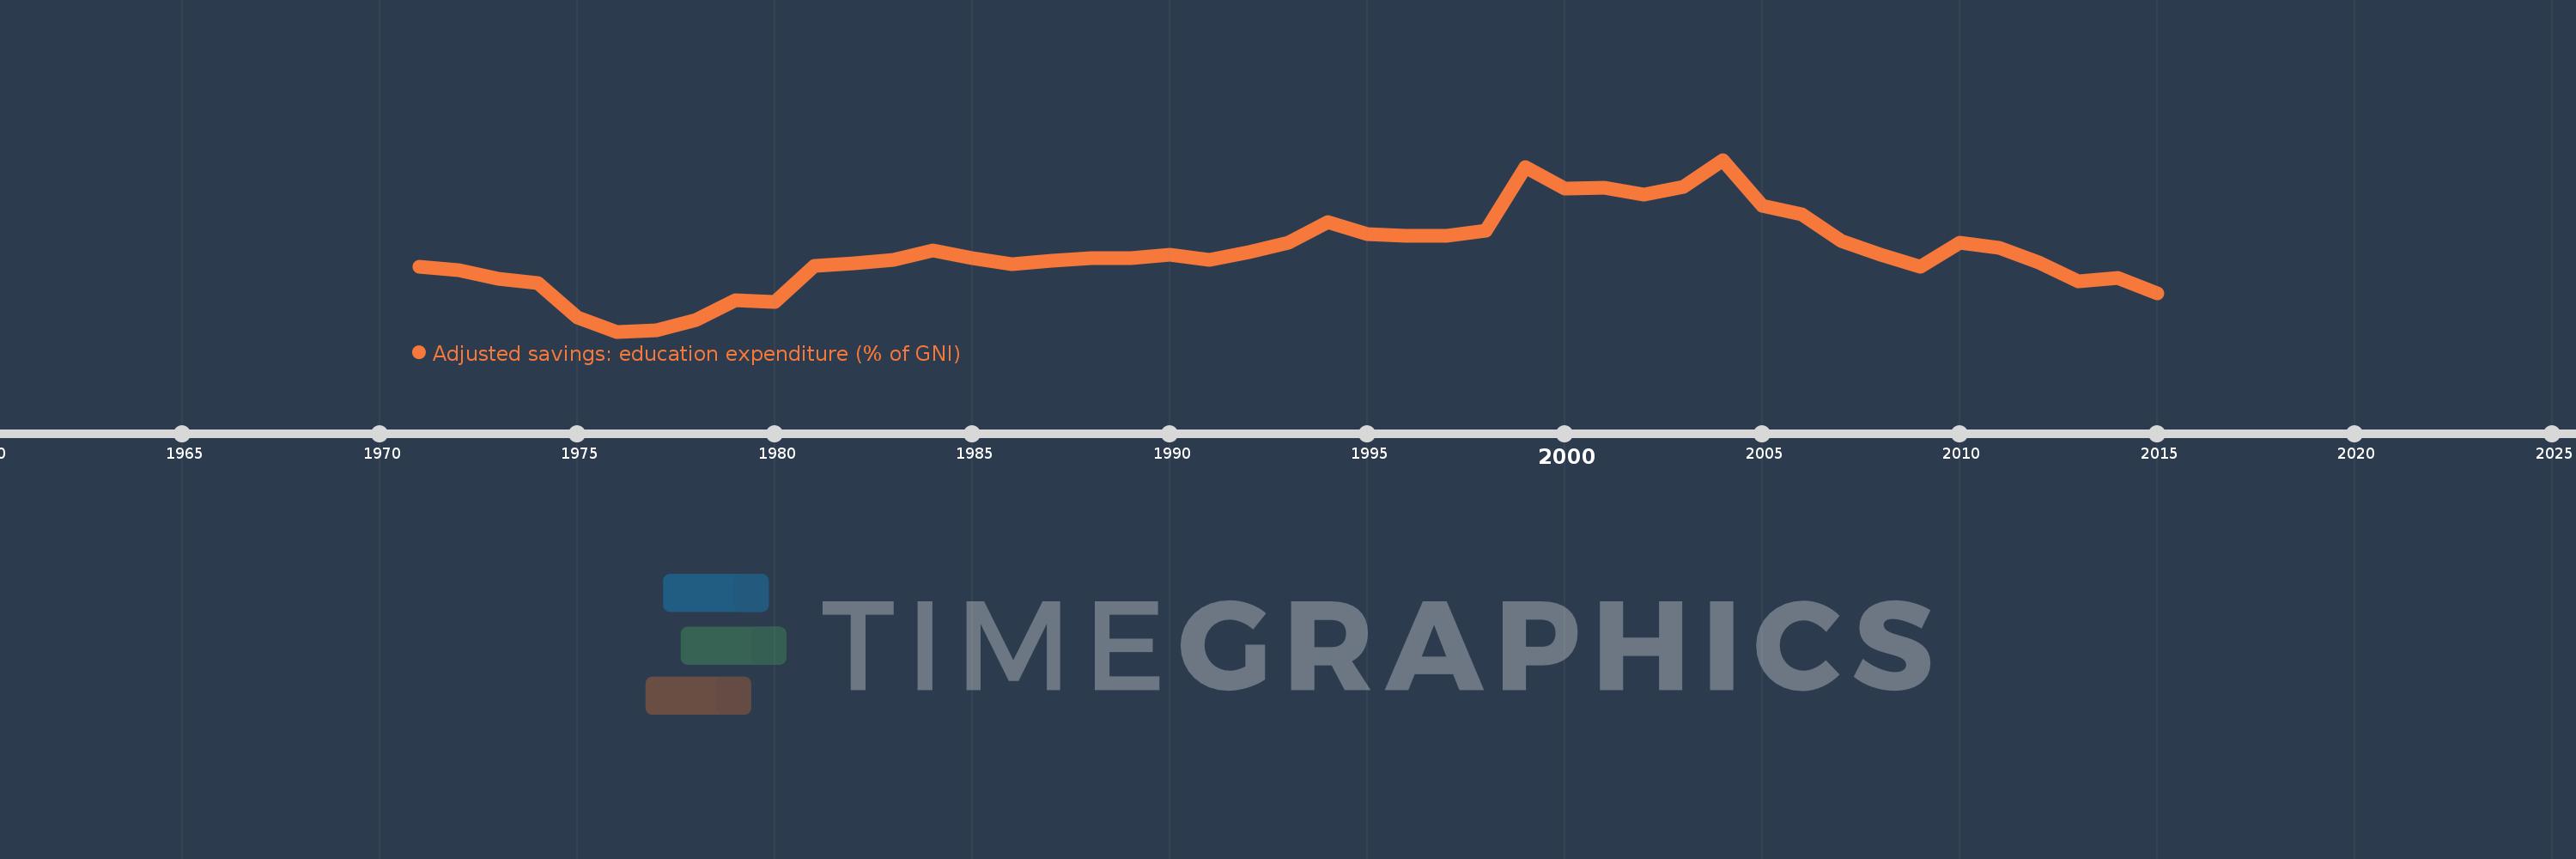
Adjusted savings: education expenditure (% of GNI)
2015,2014,2013,2012,2011,2010,2009,2008,2007,2006,2005,2004,2003,2002,2001,2000,1999,1998,1997,1996,1995,1994,1993,1992,1991,1990,1989,1988,1987,1986,1985,1984,1983,1982,1981,1980,1979,1978,1977,1976,1975,1974,1973,1972,1971
Estas estadísticas en otros países:
AfghanistanAlbaniaAlgeriaAmerican SamoaAndorraAngolaAntigua and BarbudaArab WorldArgentinaArmeniaAustraliaAustriaAzerbaijanBahamas, TheBahrainBangladeshBarbadosBelarusBelgiumBelizeBeninBermudaBhutanBoliviaBotswanaBrazilBrunei DarussalamBulgariaBurkina FasoBurundiCabo VerdeCambodiaCameroonCanadaCaribbean small statesCentral African RepublicCentral Europe and the BalticsChadChileChinaColombiaComorosCongo, Dem. Rep.Congo, Rep.Costa RicaCote d'IvoireCroatiaCubaCyprusCzech RepublicDenmarkDjiboutiDominicaDominican RepublicEarly-demographic dividendEast Asia & PacificEast Asia & Pacific (excluding high income)East Asia & Pacific (IDA & IBRD countries)EcuadorEgypt, Arab Rep.El SalvadorEquatorial GuineaEritreaEstoniaEthiopiaEuro areaEurope & Central AsiaEurope & Central Asia (excluding high income)Europe & Central Asia (IDA & IBRD countries)European UnionFijiFinlandFragile and conflict affected situationsFranceFrench PolynesiaGabonGambia, TheGeorgiaGermanyGhanaGreeceGrenadaGuatemalaGuineaGuinea-BissauGuyanaHaitiHeavily indebted poor countries (HIPC)High incomeHondurasHong Kong SAR, ChinaHungaryIBRD onlyIcelandIDA & IBRD totalIDA blendIDA onlyIDA totalIndiaIndonesiaIran, Islamic Rep.IraqIrelandIsraelItalyJamaicaJapanJordanKazakhstanKenyaKiribatiKorea, Rep.KuwaitKyrgyz RepublicLao PDRLate-demographic dividendLatin America & Caribbean Latin America & Caribbean (excluding high income)Latin America & the Caribbean (IDA & IBRD countries)LatviaLeast developed countries: UN classificationLebanonLesothoLiberiaLibyaLiechtensteinLithuaniaLow & middle incomeLow incomeLower middle incomeLuxembourgMacao SAR, ChinaMacedonia, FYRMadagascarMalawiMalaysiaMaldivesMaliMaltaMarshall IslandsMauritaniaMauritiusMexicoMicronesia, Fed. Sts.Middle East & North AfricaMiddle East & North Africa (excluding high income)Middle East & North Africa (IDA & IBRD countries)Middle incomeMoldovaMonacoMongoliaMoroccoMozambiqueMyanmarNamibiaNepalNetherlandsNew CaledoniaNew ZealandNicaraguaNigerNigeriaNorth AmericaNorwayOECD membersOmanOther small statesPacific island small statesPakistanPanamaPapua New GuineaParaguayPeruPhilippinesPolandPortugalPost-demographic dividendPre-demographic dividendPuerto RicoQatarRomaniaRussian FederationRwandaSamoaSan MarinoSao Tome and PrincipeSaudi ArabiaSenegalSerbiaSeychellesSierra LeoneSingaporeSlovak RepublicSloveniaSmall statesSolomon IslandsSomaliaSouth AfricaSouth AsiaSouth Asia (IDA & IBRD)SpainSri LankaSt. Kitts and NevisSt. LuciaSt. Vincent and the GrenadinesSub-Saharan Africa Sub-Saharan Africa (excluding high income)Sub-Saharan Africa (IDA & IBRD countries)SudanSurinameSwazilandSwedenSwitzerlandSyrian Arab RepublicTajikistanTanzaniaThailandTimor-LesteTogoTongaTrinidad and TobagoTunisiaTurkeyTurkmenistanUgandaUkraineUnited KingdomUnited StatesUpper middle incomeUruguayUzbekistanVanuatuVenezuela, RBVietnamVirgin Islands (U.S.)WorldYemen, Rep.ZambiaZimbabwe línea de tiempo (timeline):
En esta escala de tiempo se presenta un gráfico de 1971 y 2015 de Other small states. Los datos de 1970 están ausentes. El número de observaciones reales por fecha: 45.
Fuente (nombre):
Indicadores del desarrollo mundial
Fuente (organización):
World Bank staff estimates using data from the United Nations Statistics Division's Statistical Yearbook, and the UNESCO Institute for Statistics online database.
Categorías:
Economy & Growth, Environment
Se ha actualizado:
23 abr 2017 año
Los indicadores de los cambios de valor en los últimos años
Mínimo:
2.696
1 ene 1976 año
Máximo:
5.137
1 ene 2004 año
A la fecha de observación
Valor
Cambio absoluto
El cambio con respecto al valor anterior
1 ene 1971 año
3.617
+3.617
0.0%
1 ene 1972 año
3.574
-0.043
-1.19%
1 ene 1973 año
3.446
-0.128
-3.58%
1 ene 1974 año
3.386
-0.06
-1.74%
1 ene 1975 año
2.897
-0.488
-14.42%
1 ene 1976 año
2.696
-0.202
-6.95%
1 ene 1977 año
2.714
+0.018
0.66%
1 ene 1978 año
2.858
+0.145
5.33%
1 ene 1979 año
3.142
+0.283
9.91%
1 ene 1980 año
3.122
-0.02
-0.64%
1 ene 1981 año
3.628
+0.507
16.24%
1 ene 1982 año
3.672
+0.044
1.2%
1 ene 1983 año
3.72
+0.048
1.32%
1 ene 1984 año
3.848
+0.127
3.42%
1 ene 1985 año
3.74
-0.108
-2.8%
1 ene 1986 año
3.654
-0.086
-2.3%
1 ene 1987 año
3.707
+0.053
1.46%
1 ene 1988 año
3.745
+0.038
1.04%
1 ene 1989 año
3.743
-0.002
-0.06%
1 ene 1990 año
3.783
+0.04
1.06%
1 ene 1991 año
3.717
-0.065
-1.73%
1 ene 1992 año
3.831
+0.114
3.06%
1 ene 1993 año
3.958
+0.127
3.32%
1 ene 1994 año
4.252
+0.294
7.43%
1 ene 1995 año
4.08
-0.172
-4.06%
1 ene 1996 año
4.055
-0.025
-0.62%
1 ene 1997 año
4.056
+0.002
0.04%
1 ene 1998 año
4.126
+0.069
1.7%
1 ene 1999 año
5.034
+0.908
22.02%
1 ene 2000 año
4.725
-0.309
-6.13%
1 ene 2001 año
4.746
+0.021
0.44%
1 ene 2002 año
4.648
-0.098
-2.07%
1 ene 2003 año
4.75
+0.102
2.19%
1 ene 2004 año
5.137
+0.387
8.15%
1 ene 2005 año
4.485
-0.652
-12.69%
1 ene 2006 año
4.36
-0.125
-2.79%
1 ene 2007 año
3.983
-0.377
-8.64%
1 ene 2008 año
3.791
-0.192
-4.82%
1 ene 2009 año
3.616
-0.175
-4.62%
1 ene 2010 año
3.965
+0.349
9.65%
1 ene 2011 año
3.885
-0.08
-2.02%
1 ene 2012 año
3.678
-0.206
-5.31%
1 ene 2013 año
3.416
-0.263
-7.14%
1 ene 2014 año
3.459
+0.043
1.27%
1 ene 2015 año
3.242
-0.217
-6.27%
Ranking de los países por los datos estadísticos actuales


Comentarios: