29
/es/
es
AIzaSyAYiBZKx7MnpbEhh9jyipgxe19OcubqV5w
April 1, 2024
43167
Latin America & the Caribbean (IDA & IBRD countries)
TLA
false
2
1
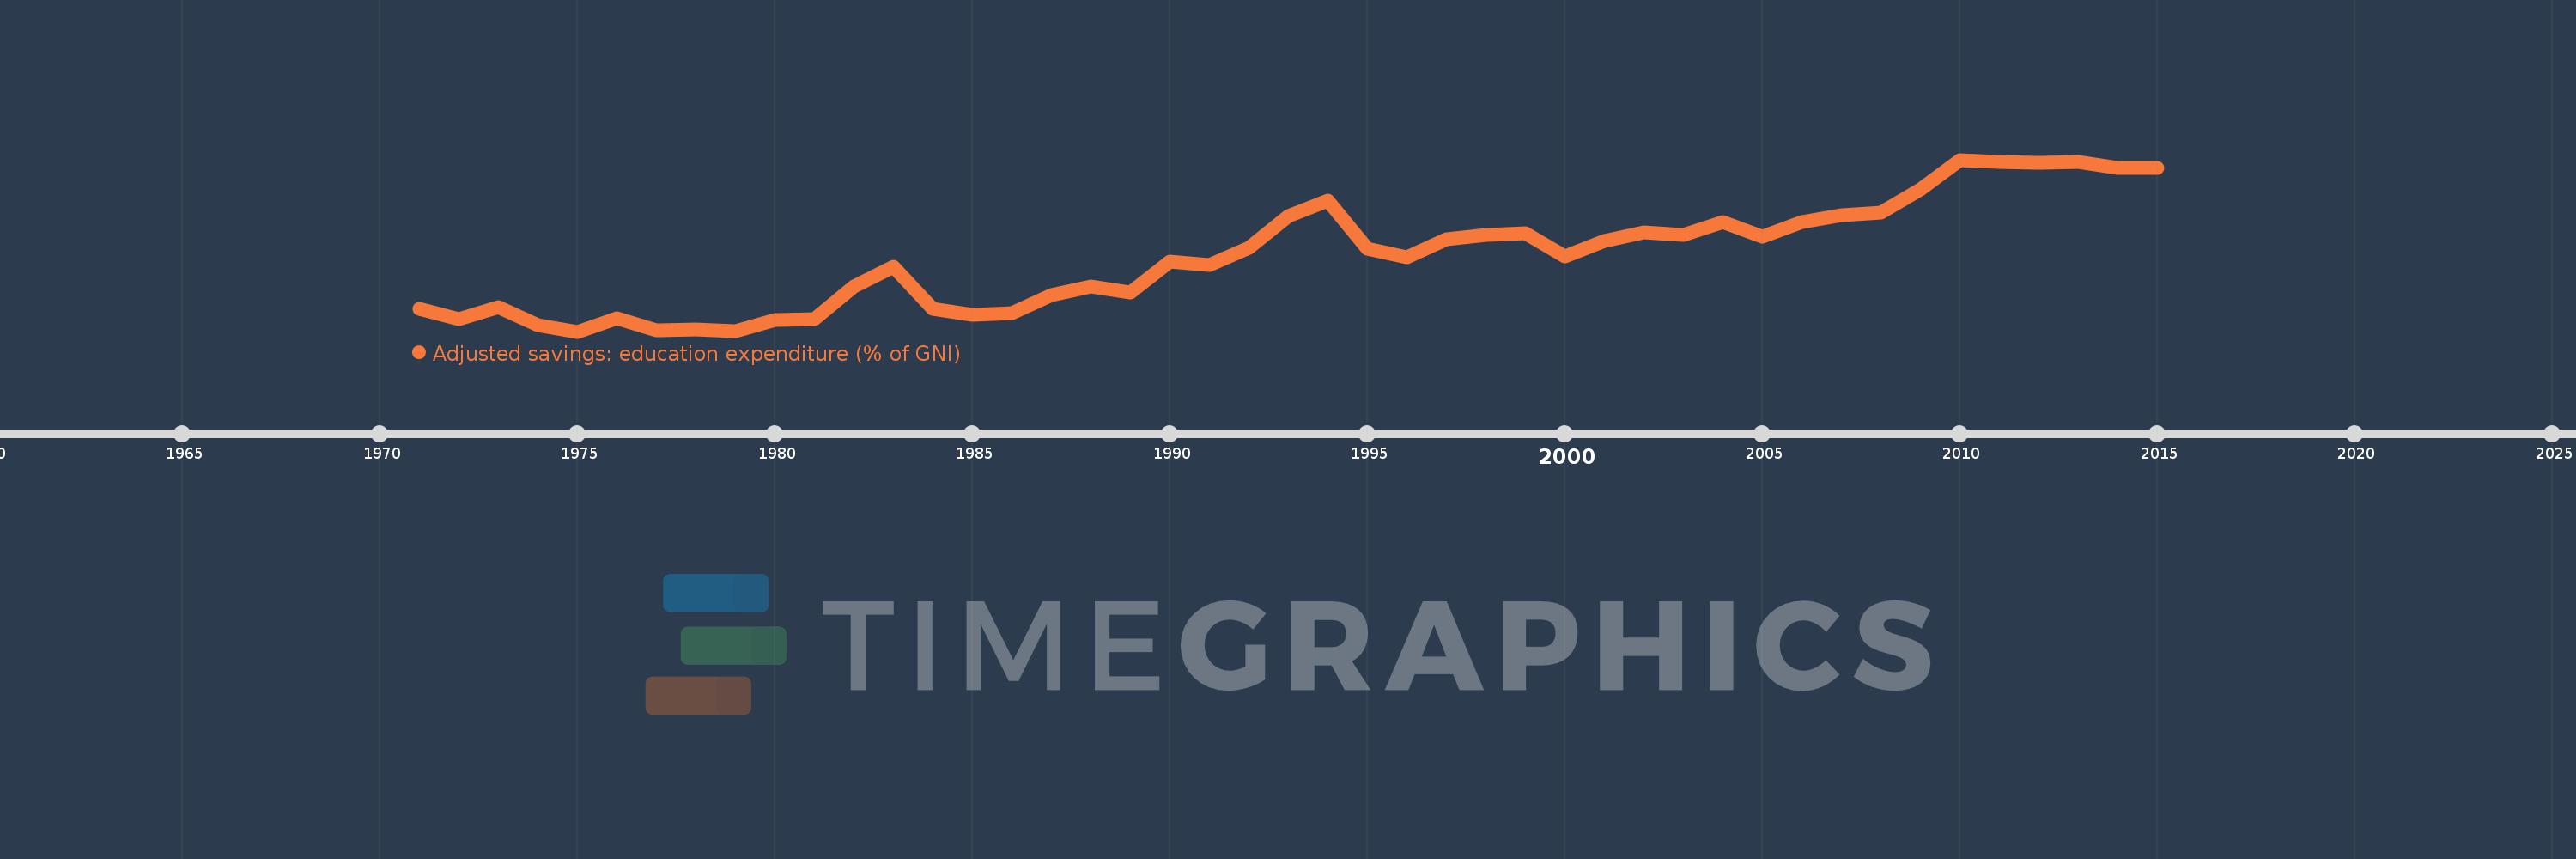
Adjusted savings: education expenditure (% of GNI)
2015,2014,2013,2012,2011,2010,2009,2008,2007,2006,2005,2004,2003,2002,2001,2000,1999,1998,1997,1996,1995,1994,1993,1992,1991,1990,1989,1988,1987,1986,1985,1984,1983,1982,1981,1980,1979,1978,1977,1976,1975,1974,1973,1972,1971
Estas estadísticas en otros países:
AfghanistanAlbaniaAlgeriaAmerican SamoaAndorraAngolaAntigua and BarbudaArab WorldArgentinaArmeniaAustraliaAustriaAzerbaijanBahamas, TheBahrainBangladeshBarbadosBelarusBelgiumBelizeBeninBermudaBhutanBoliviaBotswanaBrazilBrunei DarussalamBulgariaBurkina FasoBurundiCabo VerdeCambodiaCameroonCanadaCaribbean small statesCentral African RepublicCentral Europe and the BalticsChadChileChinaColombiaComorosCongo, Dem. Rep.Congo, Rep.Costa RicaCote d'IvoireCroatiaCubaCyprusCzech RepublicDenmarkDjiboutiDominicaDominican RepublicEarly-demographic dividendEast Asia & PacificEast Asia & Pacific (excluding high income)East Asia & Pacific (IDA & IBRD countries)EcuadorEgypt, Arab Rep.El SalvadorEquatorial GuineaEritreaEstoniaEthiopiaEuro areaEurope & Central AsiaEurope & Central Asia (excluding high income)Europe & Central Asia (IDA & IBRD countries)European UnionFijiFinlandFragile and conflict affected situationsFranceFrench PolynesiaGabonGambia, TheGeorgiaGermanyGhanaGreeceGrenadaGuatemalaGuineaGuinea-BissauGuyanaHaitiHeavily indebted poor countries (HIPC)High incomeHondurasHong Kong SAR, ChinaHungaryIBRD onlyIcelandIDA & IBRD totalIDA blendIDA onlyIDA totalIndiaIndonesiaIran, Islamic Rep.IraqIrelandIsraelItalyJamaicaJapanJordanKazakhstanKenyaKiribatiKorea, Rep.KuwaitKyrgyz RepublicLao PDRLate-demographic dividendLatin America & Caribbean Latin America & Caribbean (excluding high income)Latin America & the Caribbean (IDA & IBRD countries)LatviaLeast developed countries: UN classificationLebanonLesothoLiberiaLibyaLiechtensteinLithuaniaLow & middle incomeLow incomeLower middle incomeLuxembourgMacao SAR, ChinaMacedonia, FYRMadagascarMalawiMalaysiaMaldivesMaliMaltaMarshall IslandsMauritaniaMauritiusMexicoMicronesia, Fed. Sts.Middle East & North AfricaMiddle East & North Africa (excluding high income)Middle East & North Africa (IDA & IBRD countries)Middle incomeMoldovaMonacoMongoliaMoroccoMozambiqueMyanmarNamibiaNepalNetherlandsNew CaledoniaNew ZealandNicaraguaNigerNigeriaNorth AmericaNorwayOECD membersOmanOther small statesPacific island small statesPakistanPanamaPapua New GuineaParaguayPeruPhilippinesPolandPortugalPost-demographic dividendPre-demographic dividendPuerto RicoQatarRomaniaRussian FederationRwandaSamoaSan MarinoSao Tome and PrincipeSaudi ArabiaSenegalSerbiaSeychellesSierra LeoneSingaporeSlovak RepublicSloveniaSmall statesSolomon IslandsSomaliaSouth AfricaSouth AsiaSouth Asia (IDA & IBRD)SpainSri LankaSt. Kitts and NevisSt. LuciaSt. Vincent and the GrenadinesSub-Saharan Africa Sub-Saharan Africa (excluding high income)Sub-Saharan Africa (IDA & IBRD countries)SudanSurinameSwazilandSwedenSwitzerlandSyrian Arab RepublicTajikistanTanzaniaThailandTimor-LesteTogoTongaTrinidad and TobagoTunisiaTurkeyTurkmenistanUgandaUkraineUnited KingdomUnited StatesUpper middle incomeUruguayUzbekistanVanuatuVenezuela, RBVietnamVirgin Islands (U.S.)WorldYemen, Rep.ZambiaZimbabwe línea de tiempo (timeline):
En esta escala de tiempo se presenta un gráfico de 1971 y 2015 de Latin America & the Caribbean (IDA & IBRD countries). Los datos de 1970 están ausentes. El número de observaciones reales por fecha: 45.
Fuente (nombre):
Indicadores del desarrollo mundial
Fuente (organización):
World Bank staff estimates using data from the United Nations Statistics Division's Statistical Yearbook, and the UNESCO Institute for Statistics online database.
Categorías:
Economy & Growth, Environment
Se ha actualizado:
23 abr 2017 año
Los indicadores de los cambios de valor en los últimos años
Mínimo:
2.757
1 ene 1975 año
Máximo:
5.024
1 ene 2010 año
A la fecha de observación
Valor
Cambio absoluto
El cambio con respecto al valor anterior
1 ene 1971 año
3.06
+3.06
0.0%
1 ene 1972 año
2.922
-0.138
-4.5%
1 ene 1973 año
3.075
+0.153
5.24%
1 ene 1974 año
2.84
-0.235
-7.63%
1 ene 1975 año
2.757
-0.083
-2.94%
1 ene 1976 año
2.934
+0.177
6.43%
1 ene 1977 año
2.774
-0.16
-5.45%
1 ene 1978 año
2.781
+0.007
0.24%
1 ene 1979 año
2.76
-0.021
-0.77%
1 ene 1980 año
2.909
+0.149
5.4%
1 ene 1981 año
2.927
+0.019
0.65%
1 ene 1982 año
3.35
+0.423
14.44%
1 ene 1983 año
3.615
+0.265
7.9%
1 ene 1984 año
3.053
-0.562
-15.54%
1 ene 1985 año
2.98
-0.073
-2.39%
1 ene 1986 año
3.004
+0.024
0.81%
1 ene 1987 año
3.236
+0.232
7.73%
1 ene 1988 año
3.348
+0.112
3.45%
1 ene 1989 año
3.278
-0.07
-2.08%
1 ene 1990 año
3.683
+0.405
12.35%
1 ene 1991 año
3.636
-0.047
-1.29%
1 ene 1992 año
3.86
+0.224
6.15%
1 ene 1993 año
4.283
+0.423
10.97%
1 ene 1994 año
4.486
+0.203
4.73%
1 ene 1995 año
3.853
-0.632
-14.1%
1 ene 1996 año
3.736
-0.117
-3.04%
1 ene 1997 año
3.975
+0.239
6.39%
1 ene 1998 año
4.03
+0.055
1.39%
1 ene 1999 año
4.051
+0.021
0.53%
1 ene 2000 año
3.75
-0.301
-7.43%
1 ene 2001 año
3.949
+0.199
5.32%
1 ene 2002 año
4.062
+0.112
2.84%
1 ene 2003 año
4.035
-0.027
-0.66%
1 ene 2004 año
4.206
+0.171
4.24%
1 ene 2005 año
4.012
-0.194
-4.62%
1 ene 2006 año
4.206
+0.194
4.84%
1 ene 2007 año
4.288
+0.082
1.94%
1 ene 2008 año
4.328
+0.04
0.94%
1 ene 2009 año
4.63
+0.303
7.0%
1 ene 2010 año
5.024
+0.393
8.49%
1 ene 2011 año
5.0
-0.024
-0.47%
1 ene 2012 año
4.982
-0.018
-0.36%
1 ene 2013 año
4.994
+0.012
0.25%
1 ene 2014 año
4.92
-0.074
-1.49%
1 ene 2015 año
4.916
-0.004
-0.08%
Ranking de los países por los datos estadísticos actuales


Comentarios: