29
/es/
es
AIzaSyAYiBZKx7MnpbEhh9jyipgxe19OcubqV5w
April 1, 2024
23867
Arab World
ARB
false
2
1
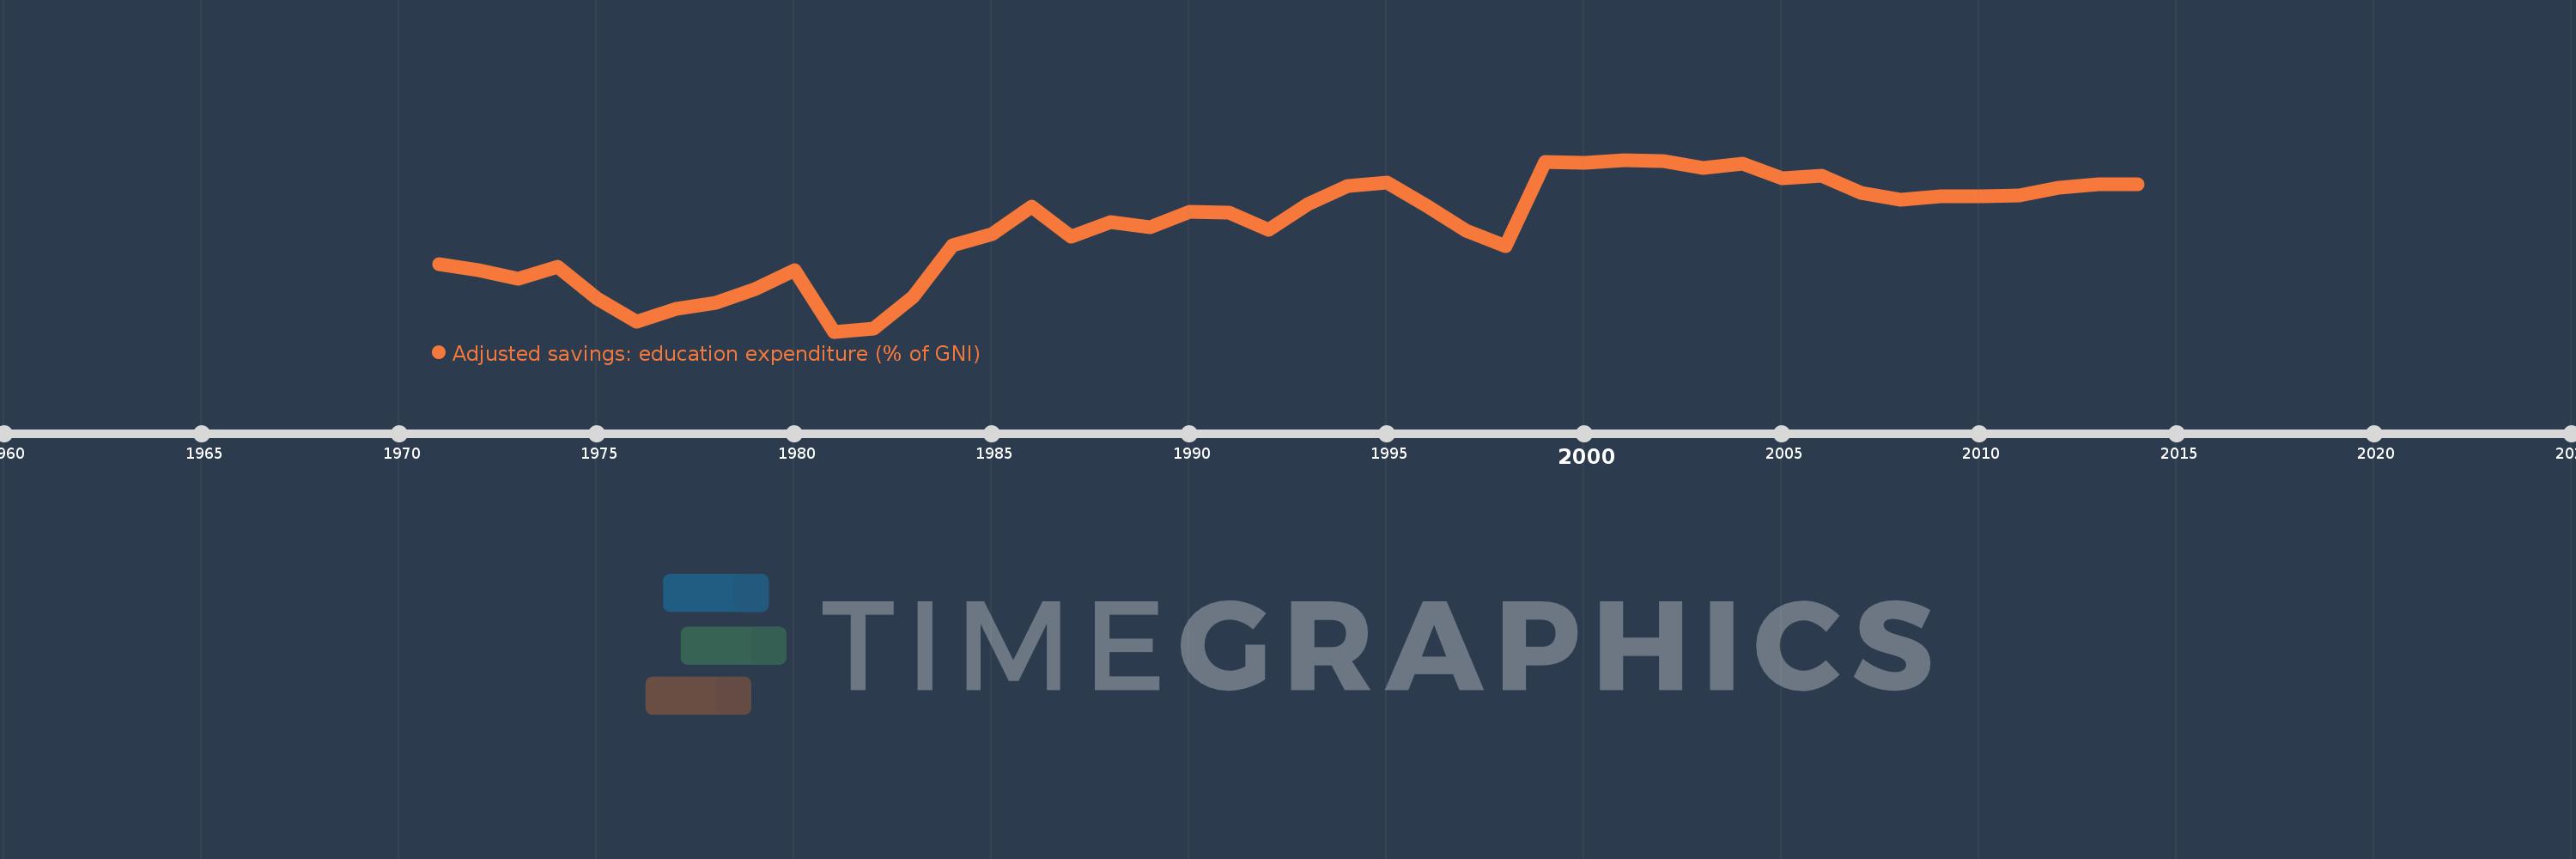
Adjusted savings: education expenditure (% of GNI)
2014,2013,2012,2011,2010,2009,2008,2007,2006,2005,2004,2003,2002,2001,2000,1999,1998,1997,1996,1995,1994,1993,1992,1991,1990,1989,1988,1987,1986,1985,1984,1983,1982,1981,1980,1979,1978,1977,1976,1975,1974,1973,1972,1971
Estas estadísticas en otros países:
AfghanistanAlbaniaAlgeriaAmerican SamoaAndorraAngolaAntigua and BarbudaArab WorldArgentinaArmeniaAustraliaAustriaAzerbaijanBahamas, TheBahrainBangladeshBarbadosBelarusBelgiumBelizeBeninBermudaBhutanBoliviaBotswanaBrazilBrunei DarussalamBulgariaBurkina FasoBurundiCabo VerdeCambodiaCameroonCanadaCaribbean small statesCentral African RepublicCentral Europe and the BalticsChadChileChinaColombiaComorosCongo, Dem. Rep.Congo, Rep.Costa RicaCote d'IvoireCroatiaCubaCyprusCzech RepublicDenmarkDjiboutiDominicaDominican RepublicEarly-demographic dividendEast Asia & PacificEast Asia & Pacific (excluding high income)East Asia & Pacific (IDA & IBRD countries)EcuadorEgypt, Arab Rep.El SalvadorEquatorial GuineaEritreaEstoniaEthiopiaEuro areaEurope & Central AsiaEurope & Central Asia (excluding high income)Europe & Central Asia (IDA & IBRD countries)European UnionFijiFinlandFragile and conflict affected situationsFranceFrench PolynesiaGabonGambia, TheGeorgiaGermanyGhanaGreeceGrenadaGuatemalaGuineaGuinea-BissauGuyanaHaitiHeavily indebted poor countries (HIPC)High incomeHondurasHong Kong SAR, ChinaHungaryIBRD onlyIcelandIDA & IBRD totalIDA blendIDA onlyIDA totalIndiaIndonesiaIran, Islamic Rep.IraqIrelandIsraelItalyJamaicaJapanJordanKazakhstanKenyaKiribatiKorea, Rep.KuwaitKyrgyz RepublicLao PDRLate-demographic dividendLatin America & Caribbean Latin America & Caribbean (excluding high income)Latin America & the Caribbean (IDA & IBRD countries)LatviaLeast developed countries: UN classificationLebanonLesothoLiberiaLibyaLiechtensteinLithuaniaLow & middle incomeLow incomeLower middle incomeLuxembourgMacao SAR, ChinaMacedonia, FYRMadagascarMalawiMalaysiaMaldivesMaliMaltaMarshall IslandsMauritaniaMauritiusMexicoMicronesia, Fed. Sts.Middle East & North AfricaMiddle East & North Africa (excluding high income)Middle East & North Africa (IDA & IBRD countries)Middle incomeMoldovaMonacoMongoliaMoroccoMozambiqueMyanmarNamibiaNepalNetherlandsNew CaledoniaNew ZealandNicaraguaNigerNigeriaNorth AmericaNorwayOECD membersOmanOther small statesPacific island small statesPakistanPanamaPapua New GuineaParaguayPeruPhilippinesPolandPortugalPost-demographic dividendPre-demographic dividendPuerto RicoQatarRomaniaRussian FederationRwandaSamoaSan MarinoSao Tome and PrincipeSaudi ArabiaSenegalSerbiaSeychellesSierra LeoneSingaporeSlovak RepublicSloveniaSmall statesSolomon IslandsSomaliaSouth AfricaSouth AsiaSouth Asia (IDA & IBRD)SpainSri LankaSt. Kitts and NevisSt. LuciaSt. Vincent and the GrenadinesSub-Saharan Africa Sub-Saharan Africa (excluding high income)Sub-Saharan Africa (IDA & IBRD countries)SudanSurinameSwazilandSwedenSwitzerlandSyrian Arab RepublicTajikistanTanzaniaThailandTimor-LesteTogoTongaTrinidad and TobagoTunisiaTurkeyTurkmenistanUgandaUkraineUnited KingdomUnited StatesUpper middle incomeUruguayUzbekistanVanuatuVenezuela, RBVietnamVirgin Islands (U.S.)WorldYemen, Rep.ZambiaZimbabwe línea de tiempo (timeline):
En esta escala de tiempo se presenta un gráfico de 1971 y 2014 de Arab World. Los datos de 1970 están ausentes. El número de observaciones reales por fecha: 44.
Fuente (nombre):
Indicadores del desarrollo mundial
Fuente (organización):
World Bank staff estimates using data from the United Nations Statistics Division's Statistical Yearbook, and the UNESCO Institute for Statistics online database.
Categorías:
Economy & Growth, Environment
Se ha actualizado:
23 abr 2017 año
Los indicadores de los cambios de valor en los últimos años
Mínimo:
3.048
1 ene 1981 año
Máximo:
5.304
1 ene 2001 año
A la fecha de observación
Valor
Cambio absoluto
El cambio con respecto al valor anterior
1 ene 1971 año
3.93
+3.93
0.0%
1 ene 1972 año
3.852
-0.078
-1.98%
1 ene 1973 año
3.742
-0.11
-2.86%
1 ene 1974 año
3.897
+0.155
4.15%
1 ene 1975 año
3.485
-0.412
-10.57%
1 ene 1976 año
3.18
-0.305
-8.75%
1 ene 1977 año
3.347
+0.166
5.23%
1 ene 1978 año
3.425
+0.078
2.34%
1 ene 1979 año
3.608
+0.183
5.35%
1 ene 1980 año
3.853
+0.244
6.77%
1 ene 1981 año
3.048
-0.804
-20.87%
1 ene 1982 año
3.093
+0.044
1.45%
1 ene 1983 año
3.51
+0.417
13.49%
1 ene 1984 año
4.181
+0.672
19.13%
1 ene 1985 año
4.325
+0.143
3.43%
1 ene 1986 año
4.691
+0.366
8.46%
1 ene 1987 año
4.295
-0.396
-8.43%
1 ene 1988 año
4.484
+0.189
4.41%
1 ene 1989 año
4.422
-0.063
-1.4%
1 ene 1990 año
4.618
+0.197
4.45%
1 ene 1991 año
4.611
-0.007
-0.15%
1 ene 1992 año
4.386
-0.225
-4.89%
1 ene 1993 año
4.726
+0.34
7.75%
1 ene 1994 año
4.963
+0.238
5.03%
1 ene 1995 año
5.006
+0.043
0.86%
1 ene 1996 año
4.704
-0.302
-6.03%
1 ene 1997 año
4.373
-0.332
-7.05%
1 ene 1998 año
4.176
-0.197
-4.5%
1 ene 1999 año
5.277
+1.101
26.36%
1 ene 2000 año
5.263
-0.014
-0.26%
1 ene 2001 año
5.304
+0.041
0.79%
1 ene 2002 año
5.286
-0.019
-0.35%
1 ene 2003 año
5.201
-0.085
-1.6%
1 ene 2004 año
5.258
+0.057
1.09%
1 ene 2005 año
5.061
-0.197
-3.75%
1 ene 2006 año
5.097
+0.037
0.72%
1 ene 2007 año
4.87
-0.227
-4.46%
1 ene 2008 año
4.785
-0.085
-1.74%
1 ene 2009 año
4.819
+0.034
0.72%
1 ene 2010 año
4.82
+0.0
0.01%
1 ene 2011 año
4.834
+0.014
0.29%
1 ene 2012 año
4.933
+0.099
2.05%
1 ene 2013 año
4.98
+0.047
0.96%
1 ene 2014 año
4.981
+0.001
0.02%
Ranking de los países por los datos estadísticos actuales


Comentarios: