29
/es/
es
AIzaSyAYiBZKx7MnpbEhh9jyipgxe19OcubqV5w
April 1, 2024
54477
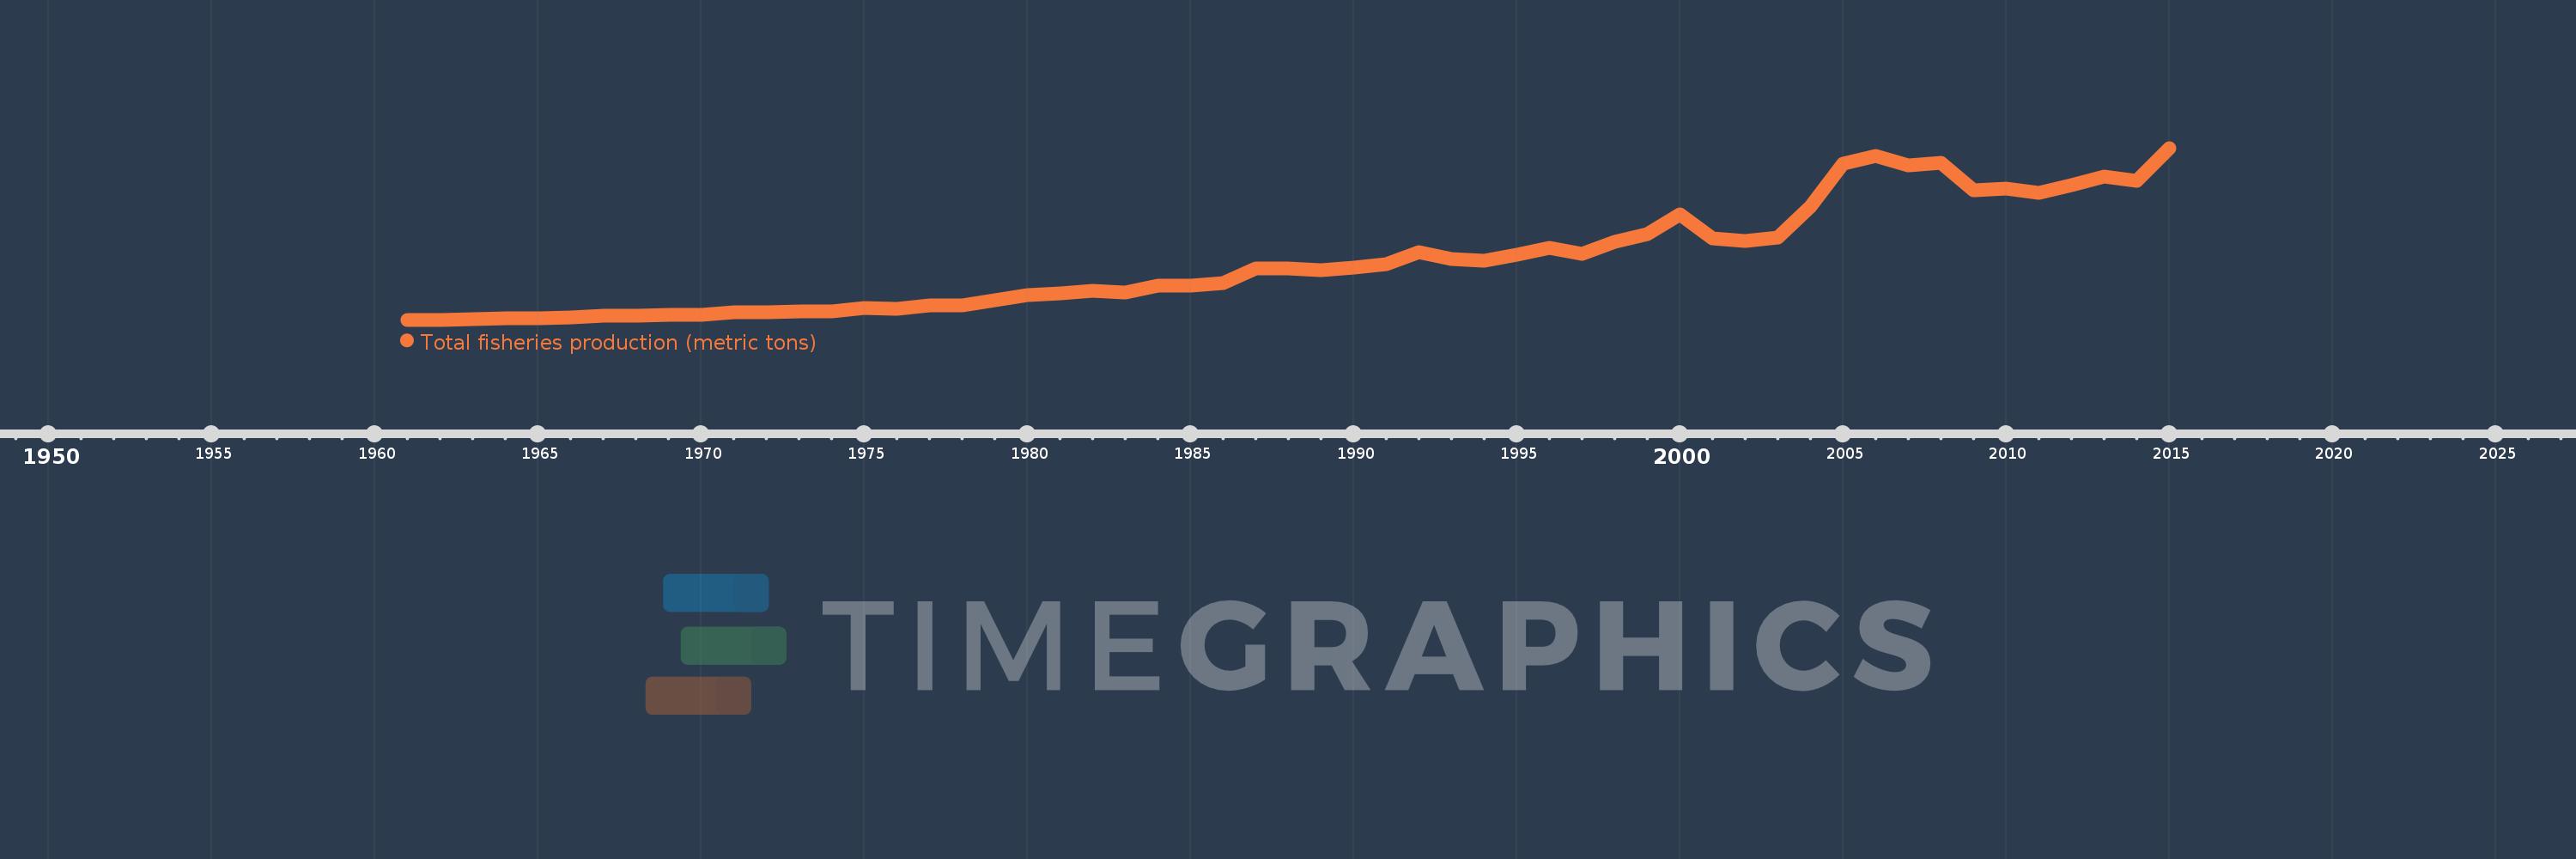
Pacific island small states
PSS
false
2
1
Total fisheries production (metric tons)
2015,2014,2013,2012,2011,2010,2009,2008,2007,2006,2005,2004,2003,2002,2001,2000,1999,1998,1997,1996,1995,1994,1993,1992,1991,1990,1989,1988,1987,1986,1985,1984,1983,1982,1981,1980,1979,1978,1977,1976,1975,1974,1973,1972,1971,1970,1969,1968,1967,1966,1965,1964,1963,1962,1961
Estas estadísticas en otros países:
AfghanistanAlbaniaAlgeriaAmerican SamoaAngolaAntigua and BarbudaArab WorldArgentinaArmeniaArubaAustraliaAustriaAzerbaijanBahamas, TheBahrainBangladeshBarbadosBelarusBelgiumBelizeBeninBermudaBhutanBoliviaBosnia and HerzegovinaBotswanaBrazilBritish Virgin IslandsBrunei DarussalamBulgariaBurkina FasoBurundiCabo VerdeCambodiaCameroonCanadaCaribbean small statesCayman IslandsCentral African RepublicCentral Europe and the BalticsChadChannel IslandsChileChinaColombiaComorosCongo, Dem. Rep.Congo, Rep.Costa RicaCote d'IvoireCroatiaCubaCuracaoCyprusCzech RepublicDenmarkDjiboutiDominicaDominican RepublicEarly-demographic dividendEast Asia & PacificEast Asia & Pacific (excluding high income)East Asia & Pacific (IDA & IBRD countries)EcuadorEgypt, Arab Rep.El SalvadorEquatorial GuineaEritreaEstoniaEthiopiaEuro areaEurope & Central AsiaEurope & Central Asia (excluding high income)Europe & Central Asia (IDA & IBRD countries)European UnionFaroe IslandsFijiFinlandFragile and conflict affected situationsFranceFrench PolynesiaGabonGambia, TheGeorgiaGermanyGhanaGreeceGreenlandGrenadaGuamGuatemalaGuineaGuinea-BissauGuyanaHaitiHeavily indebted poor countries (HIPC)High incomeHondurasHong Kong SAR, ChinaHungaryIBRD onlyIcelandIDA & IBRD totalIDA blendIDA onlyIDA totalIndiaIndonesiaIran, Islamic Rep.IraqIrelandIsle of ManIsraelItalyJamaicaJapanJordanKazakhstanKenyaKiribatiKorea, Dem. People’s Rep.Korea, Rep.KuwaitKyrgyz RepublicLao PDRLate-demographic dividendLatin America & Caribbean Latin America & Caribbean (excluding high income)Latin America & the Caribbean (IDA & IBRD countries)LatviaLeast developed countries: UN classificationLebanonLesothoLiberiaLibyaLithuaniaLow & middle incomeLow incomeLower middle incomeMacao SAR, ChinaMacedonia, FYRMadagascarMalawiMalaysiaMaldivesMaliMaltaMarshall IslandsMauritaniaMauritiusMexicoMicronesia, Fed. Sts.Middle East & North AfricaMiddle East & North Africa (excluding high income)Middle East & North Africa (IDA & IBRD countries)Middle incomeMoldovaMonacoMongoliaMontenegroMoroccoMozambiqueMyanmarNamibiaNauruNepalNetherlandsNew CaledoniaNew ZealandNicaraguaNigerNigeriaNorth AmericaNorthern Mariana IslandsNorwayOECD membersOmanOther small statesPacific island small statesPakistanPalauPanamaPapua New GuineaParaguayPeruPhilippinesPolandPortugalPost-demographic dividendPre-demographic dividendPuerto RicoQatarRomaniaRussian FederationRwandaSamoaSao Tome and PrincipeSaudi ArabiaSenegalSerbiaSeychellesSierra LeoneSingaporeSint Maarten (Dutch part)Slovak RepublicSloveniaSmall statesSolomon IslandsSomaliaSouth AfricaSouth AsiaSouth Asia (IDA & IBRD)South SudanSpainSri LankaSt. Kitts and NevisSt. LuciaSt. Martin (French part)St. Vincent and the GrenadinesSub-Saharan Africa Sub-Saharan Africa (excluding high income)Sub-Saharan Africa (IDA & IBRD countries)SudanSurinameSwazilandSwedenSwitzerlandSyrian Arab RepublicTajikistanTanzaniaThailandTimor-LesteTogoTongaTrinidad and TobagoTunisiaTurkeyTurkmenistanTurks and Caicos IslandsTuvaluUgandaUkraineUnited Arab EmiratesUnited KingdomUnited StatesUpper middle incomeUruguayUzbekistanVanuatuVenezuela, RBVietnamVirgin Islands (U.S.)West Bank and GazaWorldYemen, Rep.ZambiaZimbabwe línea de tiempo (timeline):
En esta escala de tiempo se presenta un gráfico de 1961 y 2015 de Pacific island small states. Los datos de 1960 están ausentes. El número de observaciones reales por fecha: 55.
Fuente (nombre):
Indicadores del desarrollo mundial
Fuente (organización):
Food and Agriculture Organization.
Categorías:
Environment
Se ha actualizado:
23 abr 2017 año
Los indicadores de los cambios de valor en los últimos años
Mínimo:
15.2 mil
1 ene 1961 año
Máximo:
473.931 mil
1 ene 2015 año
A la fecha de observación
Valor
Cambio absoluto
El cambio con respecto al valor anterior
1 ene 1961 año
15.2 mil
+15.2 mil
0.0%
1 ene 1962 año
15.4 mil
+200.0
1.32%
1 ene 1963 año
17.5 mil
+2.1 mil
13.64%
1 ene 1964 año
18.0 mil
+500.0
2.86%
1 ene 1965 año
19.766 mil
+1.766 mil
9.81%
1 ene 1966 año
21.87 mil
+2.104 mil
10.64%
1 ene 1967 año
25.686 mil
+3.816 mil
17.45%
1 ene 1968 año
26.706 mil
+1.02 mil
3.97%
1 ene 1969 año
28.656 mil
+1.95 mil
7.3%
1 ene 1970 año
28.362 mil
-294.0
-1.03%
1 ene 1971 año
35.182 mil
+6.82 mil
24.05%
1 ene 1972 año
34.554 mil
-628.0
-1.79%
1 ene 1973 año
38.524 mil
+3.97 mil
11.49%
1 ene 1974 año
38.574 mil
+50.0
0.13%
1 ene 1975 año
47.395 mil
+8.821 mil
22.87%
1 ene 1976 año
44.926 mil
-2.469 mil
-5.21%
1 ene 1977 año
54.382 mil
+9.456 mil
21.05%
1 ene 1978 año
52.72 mil
-1.662 mil
-3.06%
1 ene 1979 año
66.59 mil
+13.87 mil
26.31%
1 ene 1980 año
81.755 mil
+15.165 mil
22.77%
1 ene 1981 año
84.796 mil
+3.041 mil
3.72%
1 ene 1982 año
92.207 mil
+7.411 mil
8.74%
1 ene 1983 año
86.886 mil
-5.321 mil
-5.77%
1 ene 1984 año
105.228 mil
+18.342 mil
21.11%
1 ene 1985 año
106.927 mil
+1.699 mil
1.61%
1 ene 1986 año
113.006 mil
+6.079 mil
5.69%
1 ene 1987 año
151.56 mil
+38.554 mil
34.12%
1 ene 1988 año
152.78 mil
+1.22 mil
0.8%
1 ene 1989 año
148.599 mil
-4.181 mil
-2.74%
1 ene 1990 año
155.02 mil
+6.421 mil
4.32%
1 ene 1991 año
162.552 mil
+7.532 mil
4.86%
1 ene 1992 año
195.961 mil
+33.409 mil
20.55%
1 ene 1993 año
177.519 mil
-18.442 mil
-9.41%
1 ene 1994 año
171.859 mil
-5.66 mil
-3.19%
1 ene 1995 año
187.925 mil
+16.067 mil
9.35%
1 ene 1996 año
207.565 mil
+19.64 mil
10.45%
1 ene 1997 año
191.083 mil
-16.483 mil
-7.94%
1 ene 1998 año
224.093 mil
+33.011 mil
17.28%
1 ene 1999 año
243.775 mil
+19.682 mil
8.78%
1 ene 2000 año
296.53 mil
+52.754 mil
21.64%
1 ene 2001 año
232.936 mil
-63.593 mil
-21.45%
1 ene 2002 año
224.953 mil
-7.984 mil
-3.43%
1 ene 2003 año
234.674 mil
+9.722 mil
4.32%
1 ene 2004 año
316.288 mil
+81.613 mil
34.78%
1 ene 2005 año
432.154 mil
+115.866 mil
36.63%
1 ene 2006 año
453.314 mil
+21.16 mil
4.9%
1 ene 2007 año
428.21 mil
-25.105 mil
-5.54%
1 ene 2008 año
435.076 mil
+6.866 mil
1.6%
1 ene 2009 año
360.784 mil
-74.292 mil
-17.08%
1 ene 2010 año
366.556 mil
+5.772 mil
1.6%
1 ene 2011 año
354.405 mil
-12.15 mil
-3.31%
1 ene 2012 año
374.812 mil
+20.407 mil
5.76%
1 ene 2013 año
398.578 mil
+23.766 mil
6.34%
1 ene 2014 año
385.481 mil
-13.096 mil
-3.29%
1 ene 2015 año
473.931 mil
+88.449 mil
22.95%
Ranking de los países por los datos estadísticos actuales


Comentarios: