29
/es/
es
AIzaSyAYiBZKx7MnpbEhh9jyipgxe19OcubqV5w
April 1, 2024
49676
Middle East & North Africa (excluding high income)
MNA
false
2
1
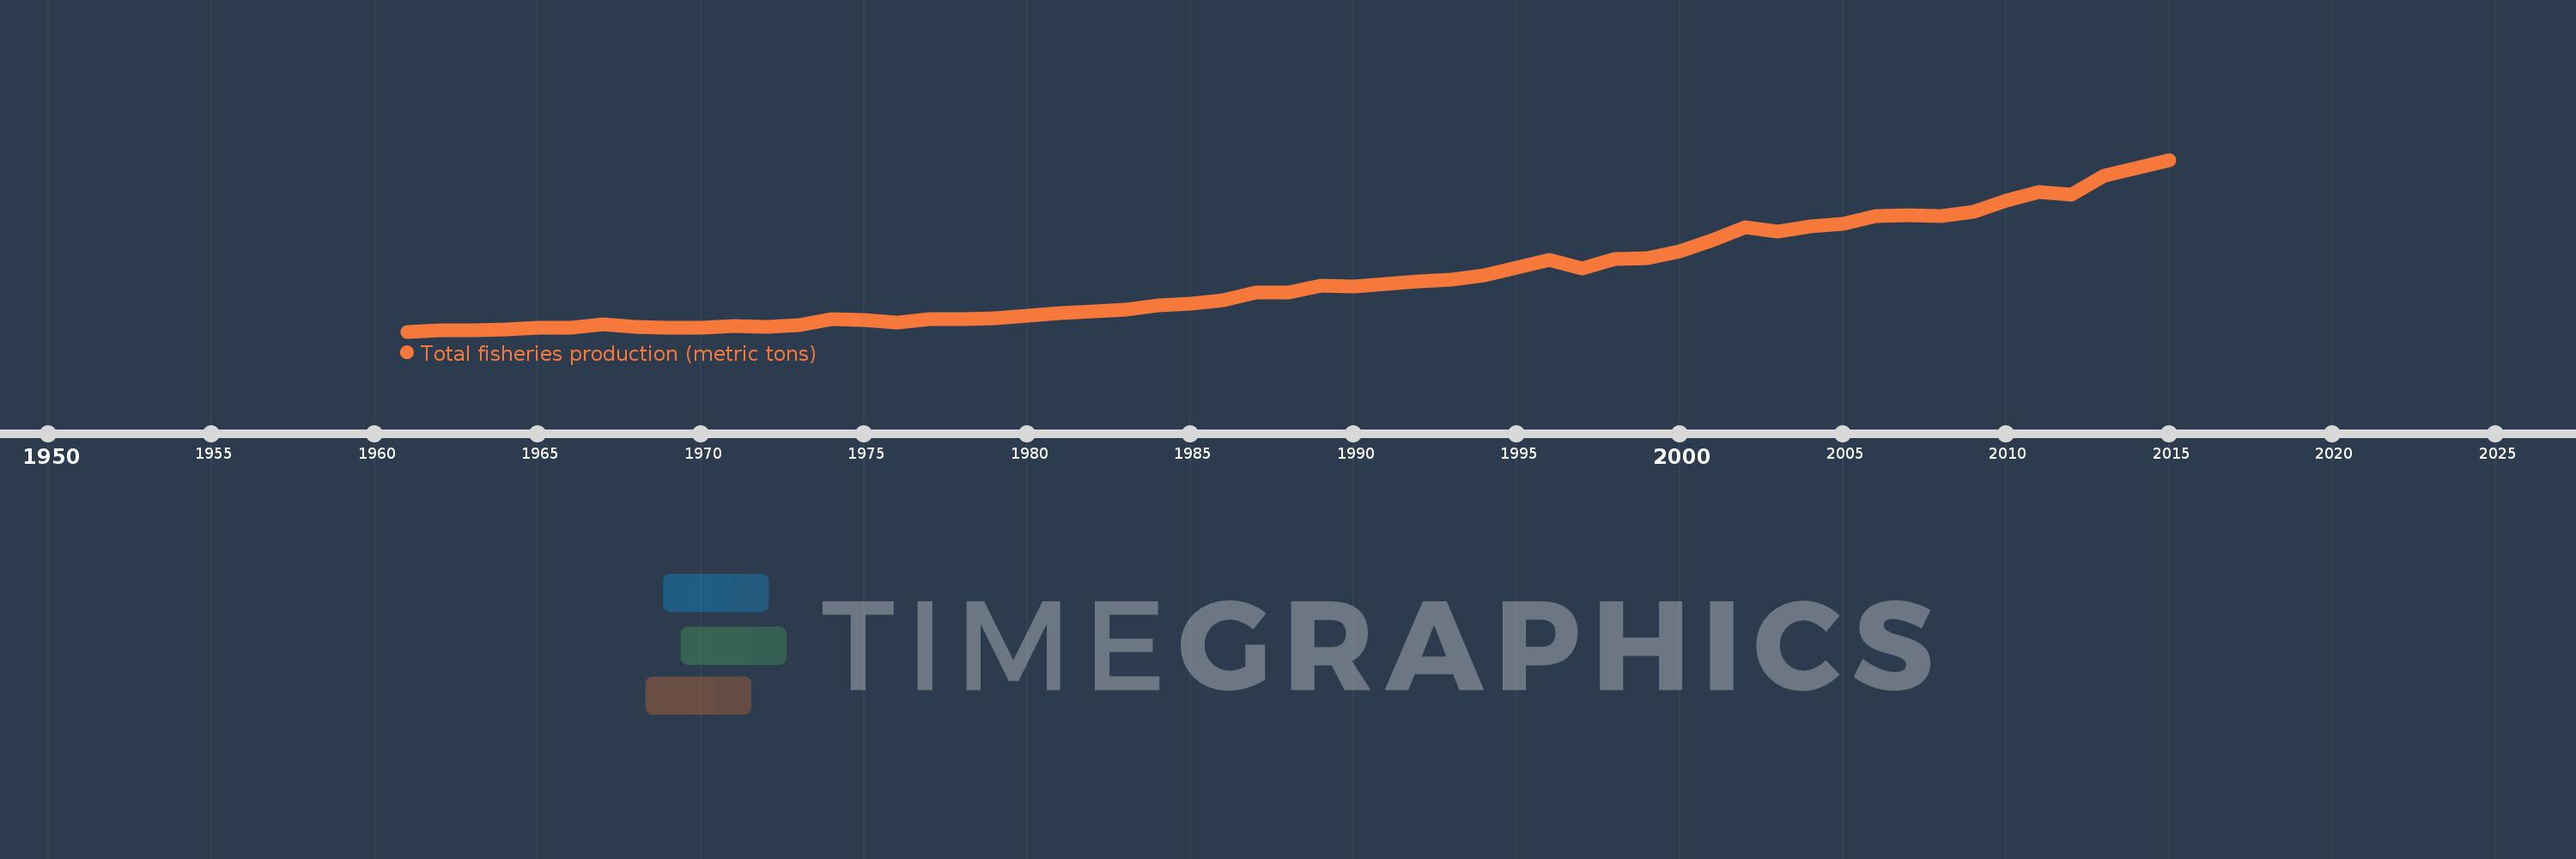
Total fisheries production (metric tons)
2015,2014,2013,2012,2011,2010,2009,2008,2007,2006,2005,2004,2003,2002,2001,2000,1999,1998,1997,1996,1995,1994,1993,1992,1991,1990,1989,1988,1987,1986,1985,1984,1983,1982,1981,1980,1979,1978,1977,1976,1975,1974,1973,1972,1971,1970,1969,1968,1967,1966,1965,1964,1963,1962,1961
Estas estadísticas en otros países:
AfghanistanAlbaniaAlgeriaAmerican SamoaAngolaAntigua and BarbudaArab WorldArgentinaArmeniaArubaAustraliaAustriaAzerbaijanBahamas, TheBahrainBangladeshBarbadosBelarusBelgiumBelizeBeninBermudaBhutanBoliviaBosnia and HerzegovinaBotswanaBrazilBritish Virgin IslandsBrunei DarussalamBulgariaBurkina FasoBurundiCabo VerdeCambodiaCameroonCanadaCaribbean small statesCayman IslandsCentral African RepublicCentral Europe and the BalticsChadChannel IslandsChileChinaColombiaComorosCongo, Dem. Rep.Congo, Rep.Costa RicaCote d'IvoireCroatiaCubaCuracaoCyprusCzech RepublicDenmarkDjiboutiDominicaDominican RepublicEarly-demographic dividendEast Asia & PacificEast Asia & Pacific (excluding high income)East Asia & Pacific (IDA & IBRD countries)EcuadorEgypt, Arab Rep.El SalvadorEquatorial GuineaEritreaEstoniaEthiopiaEuro areaEurope & Central AsiaEurope & Central Asia (excluding high income)Europe & Central Asia (IDA & IBRD countries)European UnionFaroe IslandsFijiFinlandFragile and conflict affected situationsFranceFrench PolynesiaGabonGambia, TheGeorgiaGermanyGhanaGreeceGreenlandGrenadaGuamGuatemalaGuineaGuinea-BissauGuyanaHaitiHeavily indebted poor countries (HIPC)High incomeHondurasHong Kong SAR, ChinaHungaryIBRD onlyIcelandIDA & IBRD totalIDA blendIDA onlyIDA totalIndiaIndonesiaIran, Islamic Rep.IraqIrelandIsle of ManIsraelItalyJamaicaJapanJordanKazakhstanKenyaKiribatiKorea, Dem. People’s Rep.Korea, Rep.KuwaitKyrgyz RepublicLao PDRLate-demographic dividendLatin America & Caribbean Latin America & Caribbean (excluding high income)Latin America & the Caribbean (IDA & IBRD countries)LatviaLeast developed countries: UN classificationLebanonLesothoLiberiaLibyaLithuaniaLow & middle incomeLow incomeLower middle incomeMacao SAR, ChinaMacedonia, FYRMadagascarMalawiMalaysiaMaldivesMaliMaltaMarshall IslandsMauritaniaMauritiusMexicoMicronesia, Fed. Sts.Middle East & North AfricaMiddle East & North Africa (excluding high income)Middle East & North Africa (IDA & IBRD countries)Middle incomeMoldovaMonacoMongoliaMontenegroMoroccoMozambiqueMyanmarNamibiaNauruNepalNetherlandsNew CaledoniaNew ZealandNicaraguaNigerNigeriaNorth AmericaNorthern Mariana IslandsNorwayOECD membersOmanOther small statesPacific island small statesPakistanPalauPanamaPapua New GuineaParaguayPeruPhilippinesPolandPortugalPost-demographic dividendPre-demographic dividendPuerto RicoQatarRomaniaRussian FederationRwandaSamoaSao Tome and PrincipeSaudi ArabiaSenegalSerbiaSeychellesSierra LeoneSingaporeSint Maarten (Dutch part)Slovak RepublicSloveniaSmall statesSolomon IslandsSomaliaSouth AfricaSouth AsiaSouth Asia (IDA & IBRD)South SudanSpainSri LankaSt. Kitts and NevisSt. LuciaSt. Martin (French part)St. Vincent and the GrenadinesSub-Saharan Africa Sub-Saharan Africa (excluding high income)Sub-Saharan Africa (IDA & IBRD countries)SudanSurinameSwazilandSwedenSwitzerlandSyrian Arab RepublicTajikistanTanzaniaThailandTimor-LesteTogoTongaTrinidad and TobagoTunisiaTurkeyTurkmenistanTurks and Caicos IslandsTuvaluUgandaUkraineUnited Arab EmiratesUnited KingdomUnited StatesUpper middle incomeUruguayUzbekistanVanuatuVenezuela, RBVietnamVirgin Islands (U.S.)West Bank and GazaWorldYemen, Rep.ZambiaZimbabwe línea de tiempo (timeline):
En esta escala de tiempo se presenta un gráfico de 1961 y 2015 de Middle East & North Africa (excluding high income). Los datos de 1960 están ausentes. El número de observaciones reales por fecha: 55.
Fuente (nombre):
Indicadores del desarrollo mundial
Fuente (organización):
Food and Agriculture Organization.
Categorías:
Environment
Se ha actualizado:
23 abr 2017 año
Los indicadores de los cambios de valor en los últimos años
En promedio:
1.604 millones
Mínimo:
356.278 mil
1 ene 1961 año
Máximo:
4.341 millones
1 ene 2015 año
A la fecha de observación
Valor
Cambio absoluto
El cambio con respecto al valor anterior
1 ene 1961 año
356.278 mil
+356.278 mil
0.0%
1 ene 1962 año
377.996 mil
+21.718 mil
6.1%
1 ene 1963 año
389.468 mil
+11.472 mil
3.03%
1 ene 1964 año
396.21 mil
+6.742 mil
1.73%
1 ene 1965 año
450.471 mil
+54.261 mil
13.7%
1 ene 1966 año
438.625 mil
-11.846 mil
-2.63%
1 ene 1967 año
532.365 mil
+93.74 mil
21.37%
1 ene 1968 año
470.874 mil
-61.491 mil
-11.55%
1 ene 1969 año
439.105 mil
-31.769 mil
-6.75%
1 ene 1970 año
451.718 mil
+12.613 mil
2.87%
1 ene 1971 año
477.323 mil
+25.605 mil
5.67%
1 ene 1972 año
456.841 mil
-20.482 mil
-4.29%
1 ene 1973 año
500.28 mil
+43.439 mil
9.51%
1 ene 1974 año
647.339 mil
+147.059 mil
29.4%
1 ene 1975 año
620.613 mil
-26.726 mil
-4.13%
1 ene 1976 año
570.763 mil
-49.85 mil
-8.03%
1 ene 1977 año
652.287 mil
+81.524 mil
14.28%
1 ene 1978 año
642.477 mil
-9.81 mil
-1.5%
1 ene 1979 año
664.003 mil
+21.526 mil
3.35%
1 ene 1980 año
733.904 mil
+69.901 mil
10.53%
1 ene 1981 año
788.327 mil
+54.423 mil
7.42%
1 ene 1982 año
823.66 mil
+35.333 mil
4.48%
1 ene 1983 año
859.948 mil
+36.288 mil
4.41%
1 ene 1984 año
958.706 mil
+98.759 mil
11.48%
1 ene 1985 año
1.001 millones
+42.043 mil
4.39%
1 ene 1986 año
1.09 millones
+89.479 mil
8.94%
1 ene 1987 año
1.26 millones
+170.099 mil
15.6%
1 ene 1988 año
1.259 millones
-1.35 mil
-0.11%
1 ene 1989 año
1.413 millones
+154.177 mil
12.25%
1 ene 1990 año
1.401 millones
-12.355 mil
-0.87%
1 ene 1991 año
1.468 millones
+66.833 mil
4.77%
1 ene 1992 año
1.53 millones
+62.078 mil
4.23%
1 ene 1993 año
1.56 millones
+30.155 mil
1.97%
1 ene 1994 año
1.666 millones
+106.054 mil
6.8%
1 ene 1995 año
1.844 millones
+178.126 mil
10.69%
1 ene 1996 año
2.016 millones
+172.141 mil
9.33%
1 ene 1997 año
1.825 millones
-191.651 mil
-9.51%
1 ene 1998 año
2.039 millones
+214.566 mil
11.76%
1 ene 1999 año
2.064 millones
+24.677 mil
1.21%
1 ene 2000 año
2.222 millones
+158.189 mil
7.67%
1 ene 2001 año
2.485 millones
+262.679 mil
11.82%
1 ene 2002 año
2.773 millones
+288.401 mil
11.61%
1 ene 2003 año
2.684 millones
-89.231 mil
-3.22%
1 ene 2004 año
2.797 millones
+113.237 mil
4.22%
1 ene 2005 año
2.849 millones
+52.366 mil
1.87%
1 ene 2006 año
3.038 millones
+188.486 mil
6.61%
1 ene 2007 año
3.065 millones
+26.861 mil
0.88%
1 ene 2008 año
3.027 millones
-38.182 mil
-1.25%
1 ene 2009 año
3.138 millones
+111.794 mil
3.69%
1 ene 2010 año
3.402 millones
+263.822 mil
8.41%
1 ene 2011 año
3.588 millones
+185.657 mil
5.46%
1 ene 2012 año
3.534 millones
-53.786 mil
-1.5%
1 ene 2013 año
3.966 millones
+432.348 mil
12.23%
1 ene 2014 año
4.16 millones
+193.248 mil
4.87%
1 ene 2015 año
4.341 millones
+181.291 mil
4.36%
Ranking de los países por los datos estadísticos actuales


Comentarios: