29
/es/
es
AIzaSyAYiBZKx7MnpbEhh9jyipgxe19OcubqV5w
April 1, 2024
25375
Caribbean small states
CSS
false
2
1
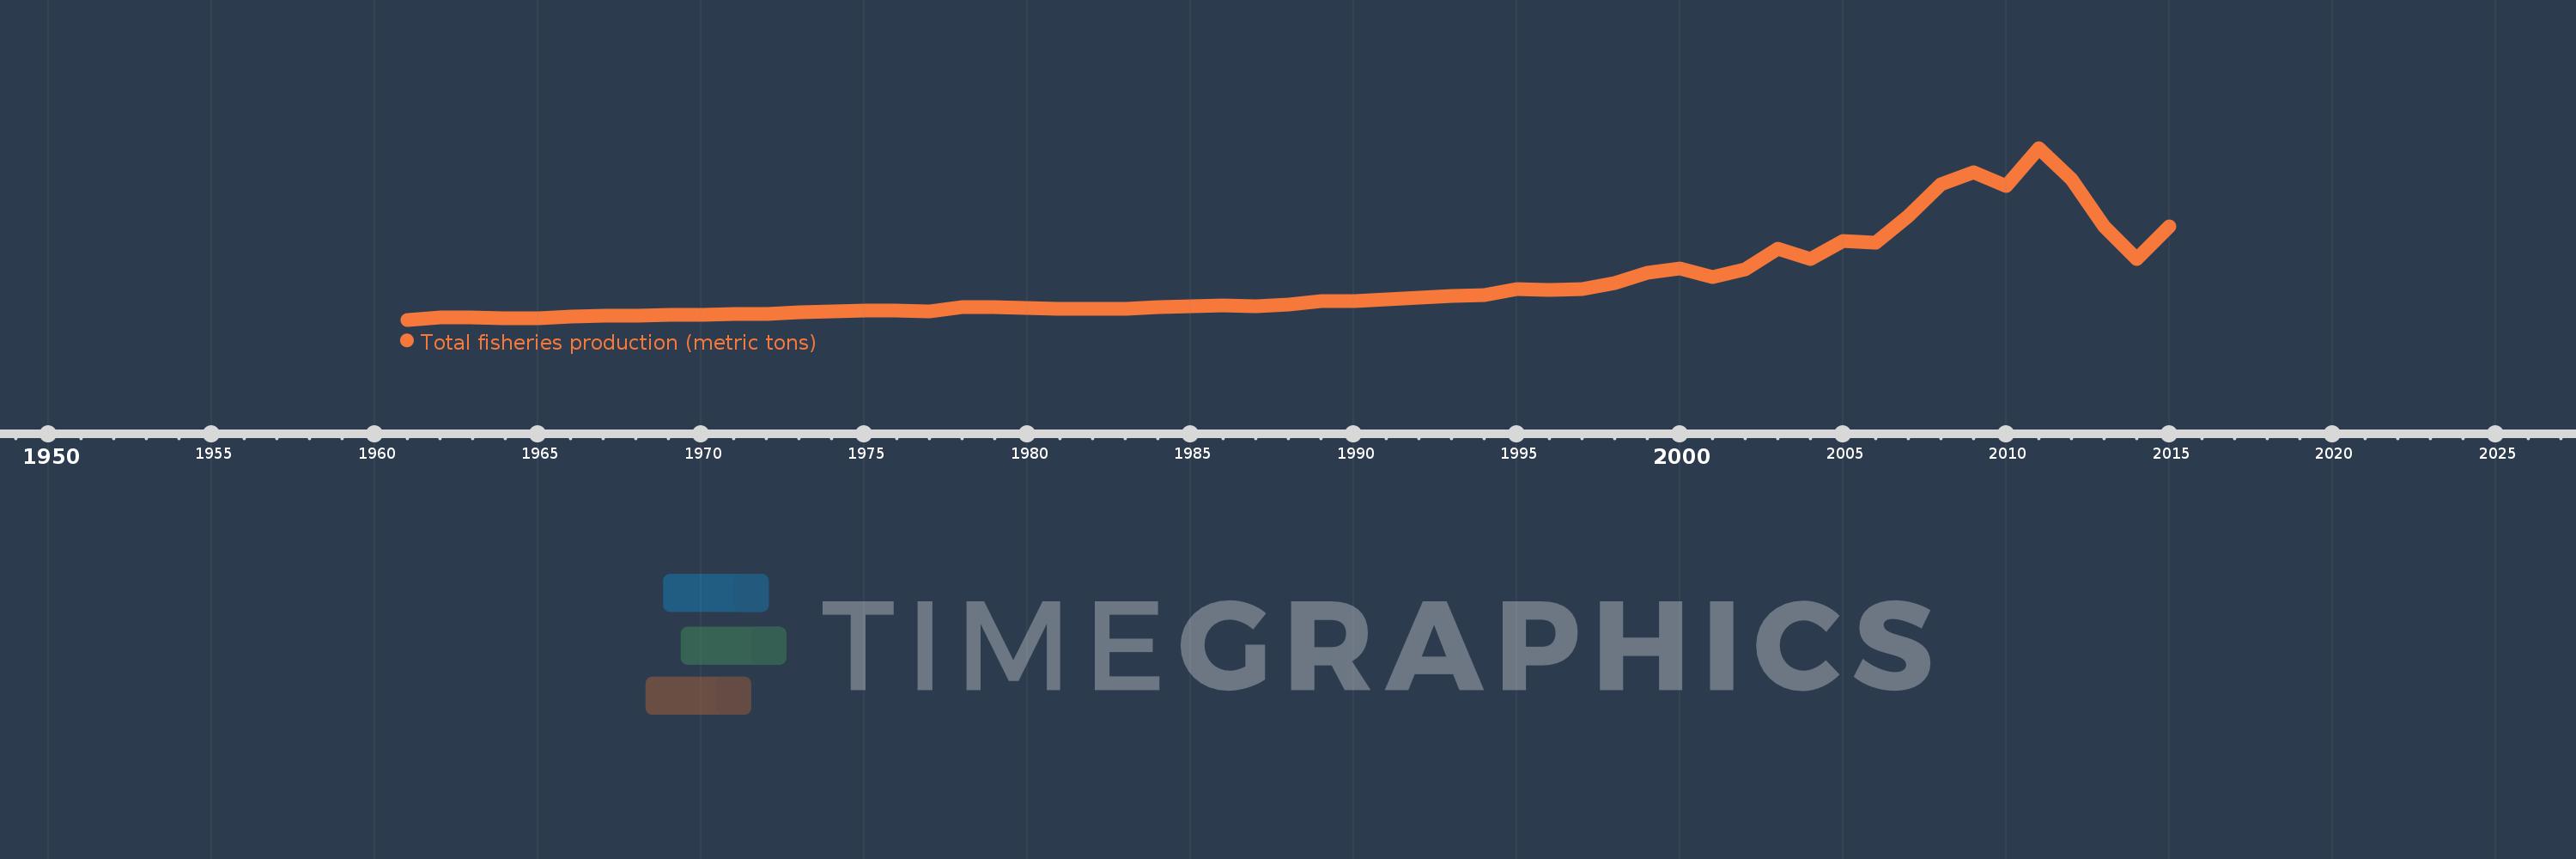
Total fisheries production (metric tons)
2015,2014,2013,2012,2011,2010,2009,2008,2007,2006,2005,2004,2003,2002,2001,2000,1999,1998,1997,1996,1995,1994,1993,1992,1991,1990,1989,1988,1987,1986,1985,1984,1983,1982,1981,1980,1979,1978,1977,1976,1975,1974,1973,1972,1971,1970,1969,1968,1967,1966,1965,1964,1963,1962,1961
Estas estadísticas en otros países:
AfghanistanAlbaniaAlgeriaAmerican SamoaAngolaAntigua and BarbudaArab WorldArgentinaArmeniaArubaAustraliaAustriaAzerbaijanBahamas, TheBahrainBangladeshBarbadosBelarusBelgiumBelizeBeninBermudaBhutanBoliviaBosnia and HerzegovinaBotswanaBrazilBritish Virgin IslandsBrunei DarussalamBulgariaBurkina FasoBurundiCabo VerdeCambodiaCameroonCanadaCaribbean small statesCayman IslandsCentral African RepublicCentral Europe and the BalticsChadChannel IslandsChileChinaColombiaComorosCongo, Dem. Rep.Congo, Rep.Costa RicaCote d'IvoireCroatiaCubaCuracaoCyprusCzech RepublicDenmarkDjiboutiDominicaDominican RepublicEarly-demographic dividendEast Asia & PacificEast Asia & Pacific (excluding high income)East Asia & Pacific (IDA & IBRD countries)EcuadorEgypt, Arab Rep.El SalvadorEquatorial GuineaEritreaEstoniaEthiopiaEuro areaEurope & Central AsiaEurope & Central Asia (excluding high income)Europe & Central Asia (IDA & IBRD countries)European UnionFaroe IslandsFijiFinlandFragile and conflict affected situationsFranceFrench PolynesiaGabonGambia, TheGeorgiaGermanyGhanaGreeceGreenlandGrenadaGuamGuatemalaGuineaGuinea-BissauGuyanaHaitiHeavily indebted poor countries (HIPC)High incomeHondurasHong Kong SAR, ChinaHungaryIBRD onlyIcelandIDA & IBRD totalIDA blendIDA onlyIDA totalIndiaIndonesiaIran, Islamic Rep.IraqIrelandIsle of ManIsraelItalyJamaicaJapanJordanKazakhstanKenyaKiribatiKorea, Dem. People’s Rep.Korea, Rep.KuwaitKyrgyz RepublicLao PDRLate-demographic dividendLatin America & Caribbean Latin America & Caribbean (excluding high income)Latin America & the Caribbean (IDA & IBRD countries)LatviaLeast developed countries: UN classificationLebanonLesothoLiberiaLibyaLithuaniaLow & middle incomeLow incomeLower middle incomeMacao SAR, ChinaMacedonia, FYRMadagascarMalawiMalaysiaMaldivesMaliMaltaMarshall IslandsMauritaniaMauritiusMexicoMicronesia, Fed. Sts.Middle East & North AfricaMiddle East & North Africa (excluding high income)Middle East & North Africa (IDA & IBRD countries)Middle incomeMoldovaMonacoMongoliaMontenegroMoroccoMozambiqueMyanmarNamibiaNauruNepalNetherlandsNew CaledoniaNew ZealandNicaraguaNigerNigeriaNorth AmericaNorthern Mariana IslandsNorwayOECD membersOmanOther small statesPacific island small statesPakistanPalauPanamaPapua New GuineaParaguayPeruPhilippinesPolandPortugalPost-demographic dividendPre-demographic dividendPuerto RicoQatarRomaniaRussian FederationRwandaSamoaSao Tome and PrincipeSaudi ArabiaSenegalSerbiaSeychellesSierra LeoneSingaporeSint Maarten (Dutch part)Slovak RepublicSloveniaSmall statesSolomon IslandsSomaliaSouth AfricaSouth AsiaSouth Asia (IDA & IBRD)South SudanSpainSri LankaSt. Kitts and NevisSt. LuciaSt. Martin (French part)St. Vincent and the GrenadinesSub-Saharan Africa Sub-Saharan Africa (excluding high income)Sub-Saharan Africa (IDA & IBRD countries)SudanSurinameSwazilandSwedenSwitzerlandSyrian Arab RepublicTajikistanTanzaniaThailandTimor-LesteTogoTongaTrinidad and TobagoTunisiaTurkeyTurkmenistanTurks and Caicos IslandsTuvaluUgandaUkraineUnited Arab EmiratesUnited KingdomUnited StatesUpper middle incomeUruguayUzbekistanVanuatuVenezuela, RBVietnamVirgin Islands (U.S.)West Bank and GazaWorldYemen, Rep.ZambiaZimbabwe línea de tiempo (timeline):
En esta escala de tiempo se presenta un gráfico de 1961 y 2015 de Caribbean small states. Los datos de 1960 están ausentes. El número de observaciones reales por fecha: 55.
Fuente (nombre):
Indicadores del desarrollo mundial
Fuente (organización):
Food and Agriculture Organization.
Categorías:
Environment
Se ha actualizado:
23 abr 2017 año
Los indicadores de los cambios de valor en los últimos años
Mínimo:
31.823 mil
1 ene 1961 año
Máximo:
636.43 mil
1 ene 2011 año
A la fecha de observación
Valor
Cambio absoluto
El cambio con respecto al valor anterior
1 ene 1961 año
31.823 mil
+31.823 mil
0.0%
1 ene 1962 año
38.713 mil
+6.89 mil
21.65%
1 ene 1963 año
38.563 mil
-150.0
-0.39%
1 ene 1964 año
36.463 mil
-2.1 mil
-5.45%
1 ene 1965 año
38.023 mil
+1.56 mil
4.28%
1 ene 1966 año
41.573 mil
+3.55 mil
9.34%
1 ene 1967 año
45.093 mil
+3.52 mil
8.47%
1 ene 1968 año
46.373 mil
+1.28 mil
2.84%
1 ene 1969 año
47.763 mil
+1.39 mil
3.0%
1 ene 1970 año
50.563 mil
+2.8 mil
5.86%
1 ene 1971 año
53.532 mil
+2.969 mil
5.87%
1 ene 1972 año
52.182 mil
-1.35 mil
-2.52%
1 ene 1973 año
56.852 mil
+4.67 mil
8.95%
1 ene 1974 año
59.65 mil
+2.798 mil
4.92%
1 ene 1975 año
63.999 mil
+4.349 mil
7.29%
1 ene 1976 año
65.49 mil
+1.491 mil
2.33%
1 ene 1977 año
61.411 mil
-4.079 mil
-6.23%
1 ene 1978 año
75.415 mil
+14.004 mil
22.8%
1 ene 1979 año
76.607 mil
+1.192 mil
1.58%
1 ene 1980 año
72.8 mil
-3.807 mil
-4.97%
1 ene 1981 año
69.658 mil
-3.142 mil
-4.32%
1 ene 1982 año
69.329 mil
-329.211
-0.47%
1 ene 1983 año
69.709 mil
+380.25
0.55%
1 ene 1984 año
77.034 mil
+7.325 mil
10.51%
1 ene 1985 año
79.237 mil
+2.203 mil
2.86%
1 ene 1986 año
83.676 mil
+4.439 mil
5.6%
1 ene 1987 año
80.006 mil
-3.67 mil
-4.39%
1 ene 1988 año
85.598 mil
+5.592 mil
6.99%
1 ene 1989 año
96.947 mil
+11.349 mil
13.26%
1 ene 1990 año
96.16 mil
-787.058
-0.81%
1 ene 1991 año
102.806 mil
+6.647 mil
6.91%
1 ene 1992 año
109.533 mil
+6.726 mil
6.54%
1 ene 1993 año
114.591 mil
+5.058 mil
4.62%
1 ene 1994 año
118.636 mil
+4.045 mil
3.53%
1 ene 1995 año
139.402 mil
+20.766 mil
17.5%
1 ene 1996 año
136.522 mil
-2.88 mil
-2.07%
1 ene 1997 año
140.127 mil
+3.605 mil
2.64%
1 ene 1998 año
161.616 mil
+21.488 mil
15.33%
1 ene 1999 año
198.597 mil
+36.981 mil
22.88%
1 ene 2000 año
212.365 mil
+13.768 mil
6.93%
1 ene 2001 año
181.456 mil
-30.909 mil
-14.55%
1 ene 2002 año
210.453 mil
+28.997 mil
15.98%
1 ene 2003 año
281.191 mil
+70.738 mil
33.61%
1 ene 2004 año
245.702 mil
-35.489 mil
-12.62%
1 ene 2005 año
308.349 mil
+62.647 mil
25.5%
1 ene 2006 año
301.808 mil
-6.541 mil
-2.12%
1 ene 2007 año
397.378 mil
+95.57 mil
31.67%
1 ene 2008 año
508.85 mil
+111.472 mil
28.05%
1 ene 2009 año
552.28 mil
+43.43 mil
8.53%
1 ene 2010 año
502.284 mil
-49.996 mil
-9.05%
1 ene 2011 año
636.43 mil
+134.147 mil
26.71%
1 ene 2012 año
526.354 mil
-110.076 mil
-17.3%
1 ene 2013 año
359.345 mil
-167.009 mil
-31.73%
1 ene 2014 año
245.576 mil
-113.769 mil
-31.66%
1 ene 2015 año
359.573 mil
+113.998 mil
46.42%
Ranking de los países por los datos estadísticos actuales


Comentarios: