29
/es/
es
AIzaSyAYiBZKx7MnpbEhh9jyipgxe19OcubqV5w
April 1, 2024
162056
Italy
ITA
true
2
1
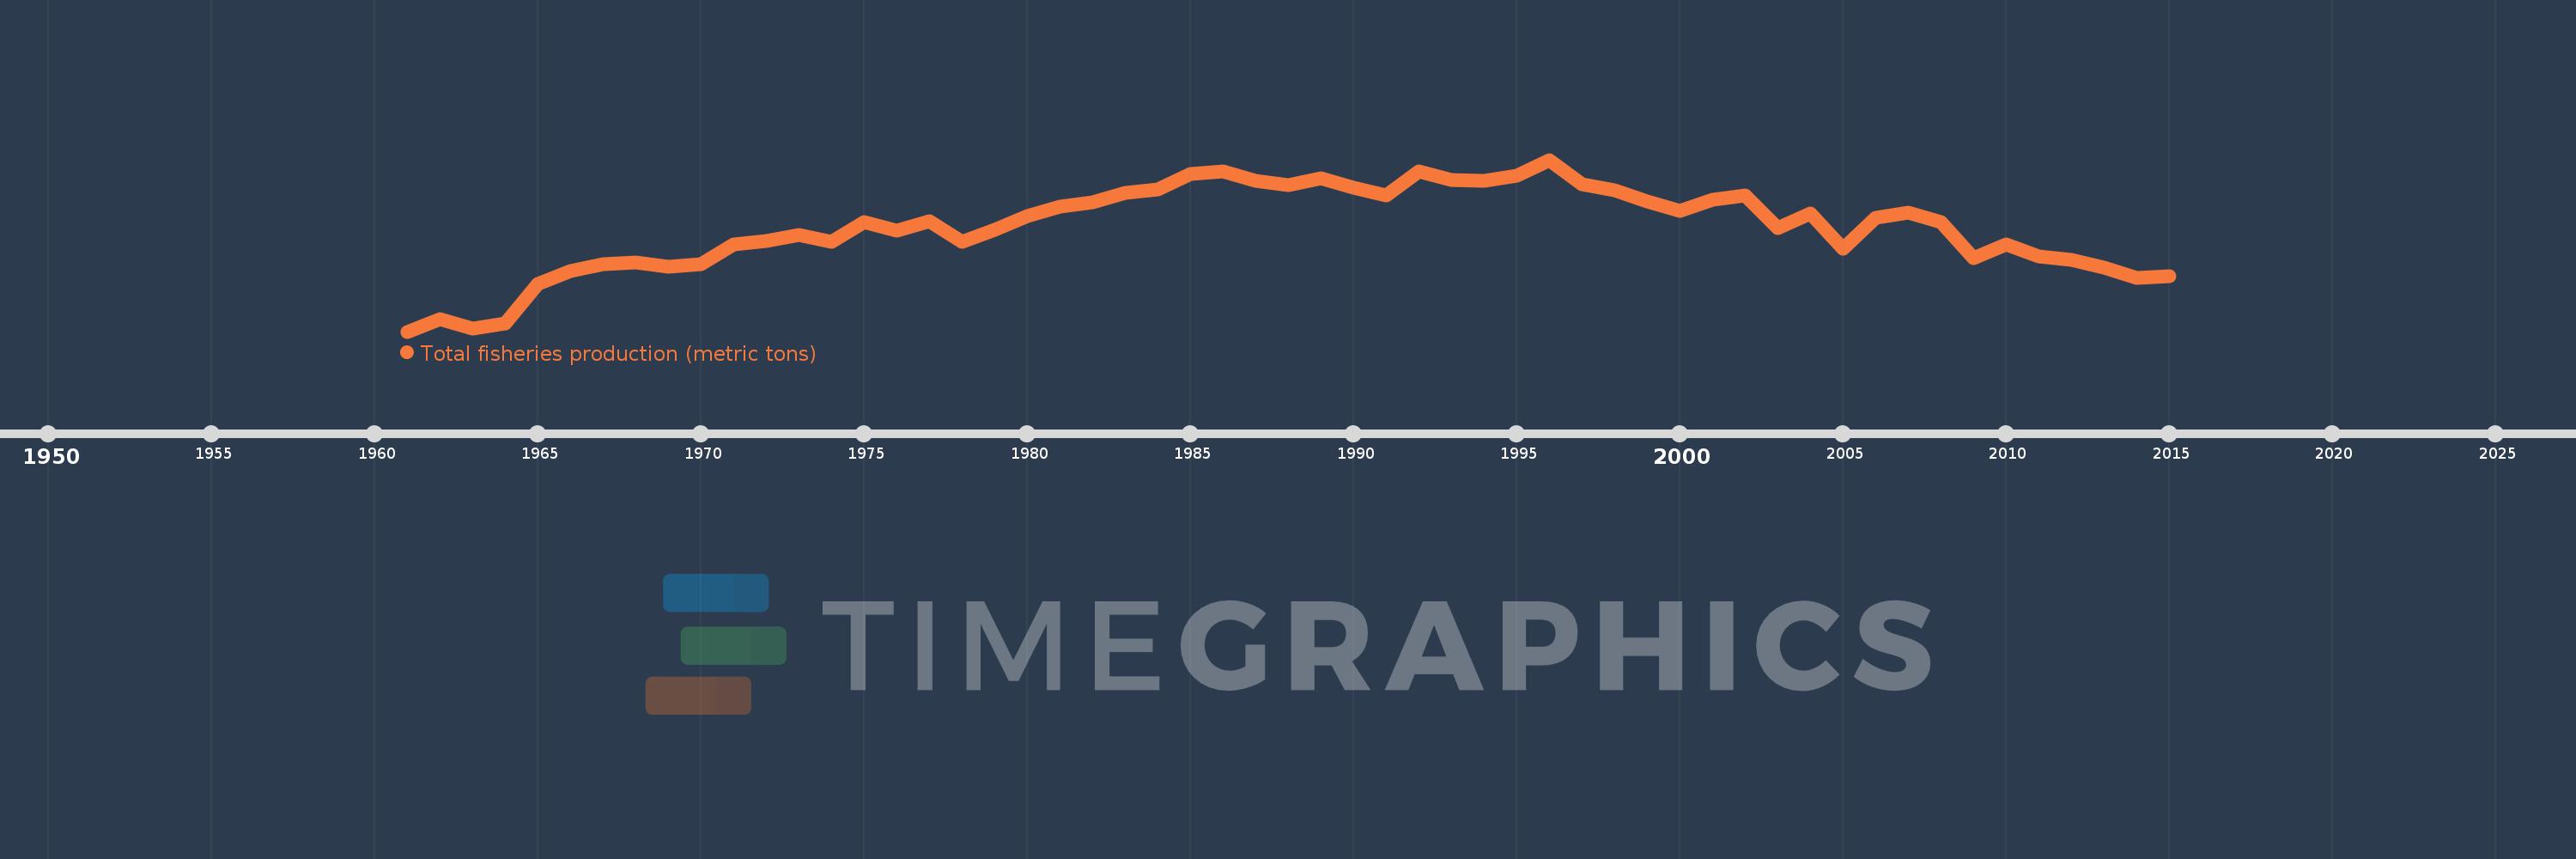
Total fisheries production (metric tons)
2015,2014,2013,2012,2011,2010,2009,2008,2007,2006,2005,2004,2003,2002,2001,2000,1999,1998,1997,1996,1995,1994,1993,1992,1991,1990,1989,1988,1987,1986,1985,1984,1983,1982,1981,1980,1979,1978,1977,1976,1975,1974,1973,1972,1971,1970,1969,1968,1967,1966,1965,1964,1963,1962,1961
Estas estadísticas en otros países:
AfghanistanAlbaniaAlgeriaAmerican SamoaAngolaAntigua and BarbudaArab WorldArgentinaArmeniaArubaAustraliaAustriaAzerbaijanBahamas, TheBahrainBangladeshBarbadosBelarusBelgiumBelizeBeninBermudaBhutanBoliviaBosnia and HerzegovinaBotswanaBrazilBritish Virgin IslandsBrunei DarussalamBulgariaBurkina FasoBurundiCabo VerdeCambodiaCameroonCanadaCaribbean small statesCayman IslandsCentral African RepublicCentral Europe and the BalticsChadChannel IslandsChileChinaColombiaComorosCongo, Dem. Rep.Congo, Rep.Costa RicaCote d'IvoireCroatiaCubaCuracaoCyprusCzech RepublicDenmarkDjiboutiDominicaDominican RepublicEarly-demographic dividendEast Asia & PacificEast Asia & Pacific (excluding high income)East Asia & Pacific (IDA & IBRD countries)EcuadorEgypt, Arab Rep.El SalvadorEquatorial GuineaEritreaEstoniaEthiopiaEuro areaEurope & Central AsiaEurope & Central Asia (excluding high income)Europe & Central Asia (IDA & IBRD countries)European UnionFaroe IslandsFijiFinlandFragile and conflict affected situationsFranceFrench PolynesiaGabonGambia, TheGeorgiaGermanyGhanaGreeceGreenlandGrenadaGuamGuatemalaGuineaGuinea-BissauGuyanaHaitiHeavily indebted poor countries (HIPC)High incomeHondurasHong Kong SAR, ChinaHungaryIBRD onlyIcelandIDA & IBRD totalIDA blendIDA onlyIDA totalIndiaIndonesiaIran, Islamic Rep.IraqIrelandIsle of ManIsraelItalyJamaicaJapanJordanKazakhstanKenyaKiribatiKorea, Dem. People’s Rep.Korea, Rep.KuwaitKyrgyz RepublicLao PDRLate-demographic dividendLatin America & Caribbean Latin America & Caribbean (excluding high income)Latin America & the Caribbean (IDA & IBRD countries)LatviaLeast developed countries: UN classificationLebanonLesothoLiberiaLibyaLithuaniaLow & middle incomeLow incomeLower middle incomeMacao SAR, ChinaMacedonia, FYRMadagascarMalawiMalaysiaMaldivesMaliMaltaMarshall IslandsMauritaniaMauritiusMexicoMicronesia, Fed. Sts.Middle East & North AfricaMiddle East & North Africa (excluding high income)Middle East & North Africa (IDA & IBRD countries)Middle incomeMoldovaMonacoMongoliaMontenegroMoroccoMozambiqueMyanmarNamibiaNauruNepalNetherlandsNew CaledoniaNew ZealandNicaraguaNigerNigeriaNorth AmericaNorthern Mariana IslandsNorwayOECD membersOmanOther small statesPacific island small statesPakistanPalauPanamaPapua New GuineaParaguayPeruPhilippinesPolandPortugalPost-demographic dividendPre-demographic dividendPuerto RicoQatarRomaniaRussian FederationRwandaSamoaSao Tome and PrincipeSaudi ArabiaSenegalSerbiaSeychellesSierra LeoneSingaporeSint Maarten (Dutch part)Slovak RepublicSloveniaSmall statesSolomon IslandsSomaliaSouth AfricaSouth AsiaSouth Asia (IDA & IBRD)South SudanSpainSri LankaSt. Kitts and NevisSt. LuciaSt. Martin (French part)St. Vincent and the GrenadinesSub-Saharan Africa Sub-Saharan Africa (excluding high income)Sub-Saharan Africa (IDA & IBRD countries)SudanSurinameSwazilandSwedenSwitzerlandSyrian Arab RepublicTajikistanTanzaniaThailandTimor-LesteTogoTongaTrinidad and TobagoTunisiaTurkeyTurkmenistanTurks and Caicos IslandsTuvaluUgandaUkraineUnited Arab EmiratesUnited KingdomUnited StatesUpper middle incomeUruguayUzbekistanVanuatuVenezuela, RBVietnamVirgin Islands (U.S.)West Bank and GazaWorldYemen, Rep.ZambiaZimbabwe línea de tiempo (timeline):
En esta escala de tiempo se presenta un gráfico de 1961 y 2015 de Italy. Los datos de 1960 están ausentes. El número de observaciones reales por fecha: 55.
Fuente (nombre):
Indicadores del desarrollo mundial
Fuente (organización):
Food and Agriculture Organization.
Categorías:
Environment
Se ha actualizado:
23 abr 2017 año
Los indicadores de los cambios de valor en los últimos años
Mínimo:
216.754 mil
1 ene 1961 año
Máximo:
612.607 mil
1 ene 1996 año
A la fecha de observación
Valor
Cambio absoluto
El cambio con respecto al valor anterior
1 ene 1961 año
216.754 mil
+216.754 mil
0.0%
1 ene 1962 año
245.206 mil
+28.452 mil
13.13%
1 ene 1963 año
223.613 mil
-21.593 mil
-8.81%
1 ene 1964 año
234.953 mil
+11.34 mil
5.07%
1 ene 1965 año
327.089 mil
+92.136 mil
39.21%
1 ene 1966 año
356.354 mil
+29.265 mil
8.95%
1 ene 1967 año
372.164 mil
+15.81 mil
4.44%
1 ene 1968 año
375.547 mil
+3.383 mil
0.91%
1 ene 1969 año
366.613 mil
-8.934 mil
-2.38%
1 ene 1970 año
372.627 mil
+6.014 mil
1.64%
1 ene 1971 año
417.749 mil
+45.122 mil
12.11%
1 ene 1972 año
426.44 mil
+8.691 mil
2.08%
1 ene 1973 año
439.063 mil
+12.623 mil
2.96%
1 ene 1974 año
424.389 mil
-14.674 mil
-3.34%
1 ene 1975 año
468.486 mil
+44.097 mil
10.39%
1 ene 1976 año
450.191 mil
-18.295 mil
-3.91%
1 ene 1977 año
471.5 mil
+21.309 mil
4.73%
1 ene 1978 año
423.787 mil
-47.713 mil
-10.12%
1 ene 1979 año
451.257 mil
+27.47 mil
6.48%
1 ene 1980 año
482.593 mil
+31.336 mil
6.94%
1 ene 1981 año
504.906 mil
+22.312 mil
4.62%
1 ene 1982 año
513.736 mil
+8.831 mil
1.75%
1 ene 1983 año
536.818 mil
+23.082 mil
4.49%
1 ene 1984 año
543.955 mil
+7.138 mil
1.33%
1 ene 1985 año
580.931 mil
+36.975 mil
6.8%
1 ene 1986 año
586.603 mil
+5.673 mil
0.98%
1 ene 1987 año
564.362 mil
-22.241 mil
-3.79%
1 ene 1988 año
554.466 mil
-9.897 mil
-1.75%
1 ene 1989 año
570.739 mil
+16.274 mil
2.94%
1 ene 1990 año
548.858 mil
-21.881 mil
-3.83%
1 ene 1991 año
531.04 mil
-17.818 mil
-3.25%
1 ene 1992 año
586.52 mil
+55.48 mil
10.45%
1 ene 1993 año
566.845 mil
-19.676 mil
-3.35%
1 ene 1994 año
563.862 mil
-2.982 mil
-0.53%
1 ene 1995 año
575.76 mil
+11.897 mil
2.11%
1 ene 1996 año
612.607 mil
+36.847 mil
6.4%
1 ene 1997 año
557.128 mil
-55.48 mil
-9.06%
1 ene 1998 año
541.369 mil
-15.759 mil
-2.83%
1 ene 1999 año
517.11 mil
-24.259 mil
-4.48%
1 ene 2000 año
495.19 mil
-21.919 mil
-4.24%
1 ene 2001 año
520.682 mil
+25.491 mil
5.15%
1 ene 2002 año
530.739 mil
+10.057 mil
1.93%
1 ene 2003 año
456.187 mil
-74.552 mil
-14.05%
1 ene 2004 año
489.585 mil
+33.398 mil
7.32%
1 ene 2005 año
407.157 mil
-82.428 mil
-16.84%
1 ene 2006 año
479.685 mil
+72.528 mil
17.81%
1 ene 2007 año
490.877 mil
+11.192 mil
2.33%
1 ene 2008 año
469.082 mil
-21.794 mil
-4.44%
1 ene 2009 año
386.622 mil
-82.46 mil
-17.58%
1 ene 2010 año
417.248 mil
+30.625 mil
7.92%
1 ene 2011 año
389.555 mil
-27.692 mil
-6.64%
1 ene 2012 año
382.3 mil
-7.255 mil
-1.86%
1 ene 2013 año
365.048 mil
-17.252 mil
-4.51%
1 ene 2014 año
340.538 mil
-24.511 mil
-6.71%
1 ene 2015 año
344.584 mil
+4.046 mil
1.19%
Ranking de los países por los datos estadísticos actuales


Comentarios: