29
/es/
es
AIzaSyAYiBZKx7MnpbEhh9jyipgxe19OcubqV5w
April 1, 2024
53536
Other small states
OSS
false
2
1
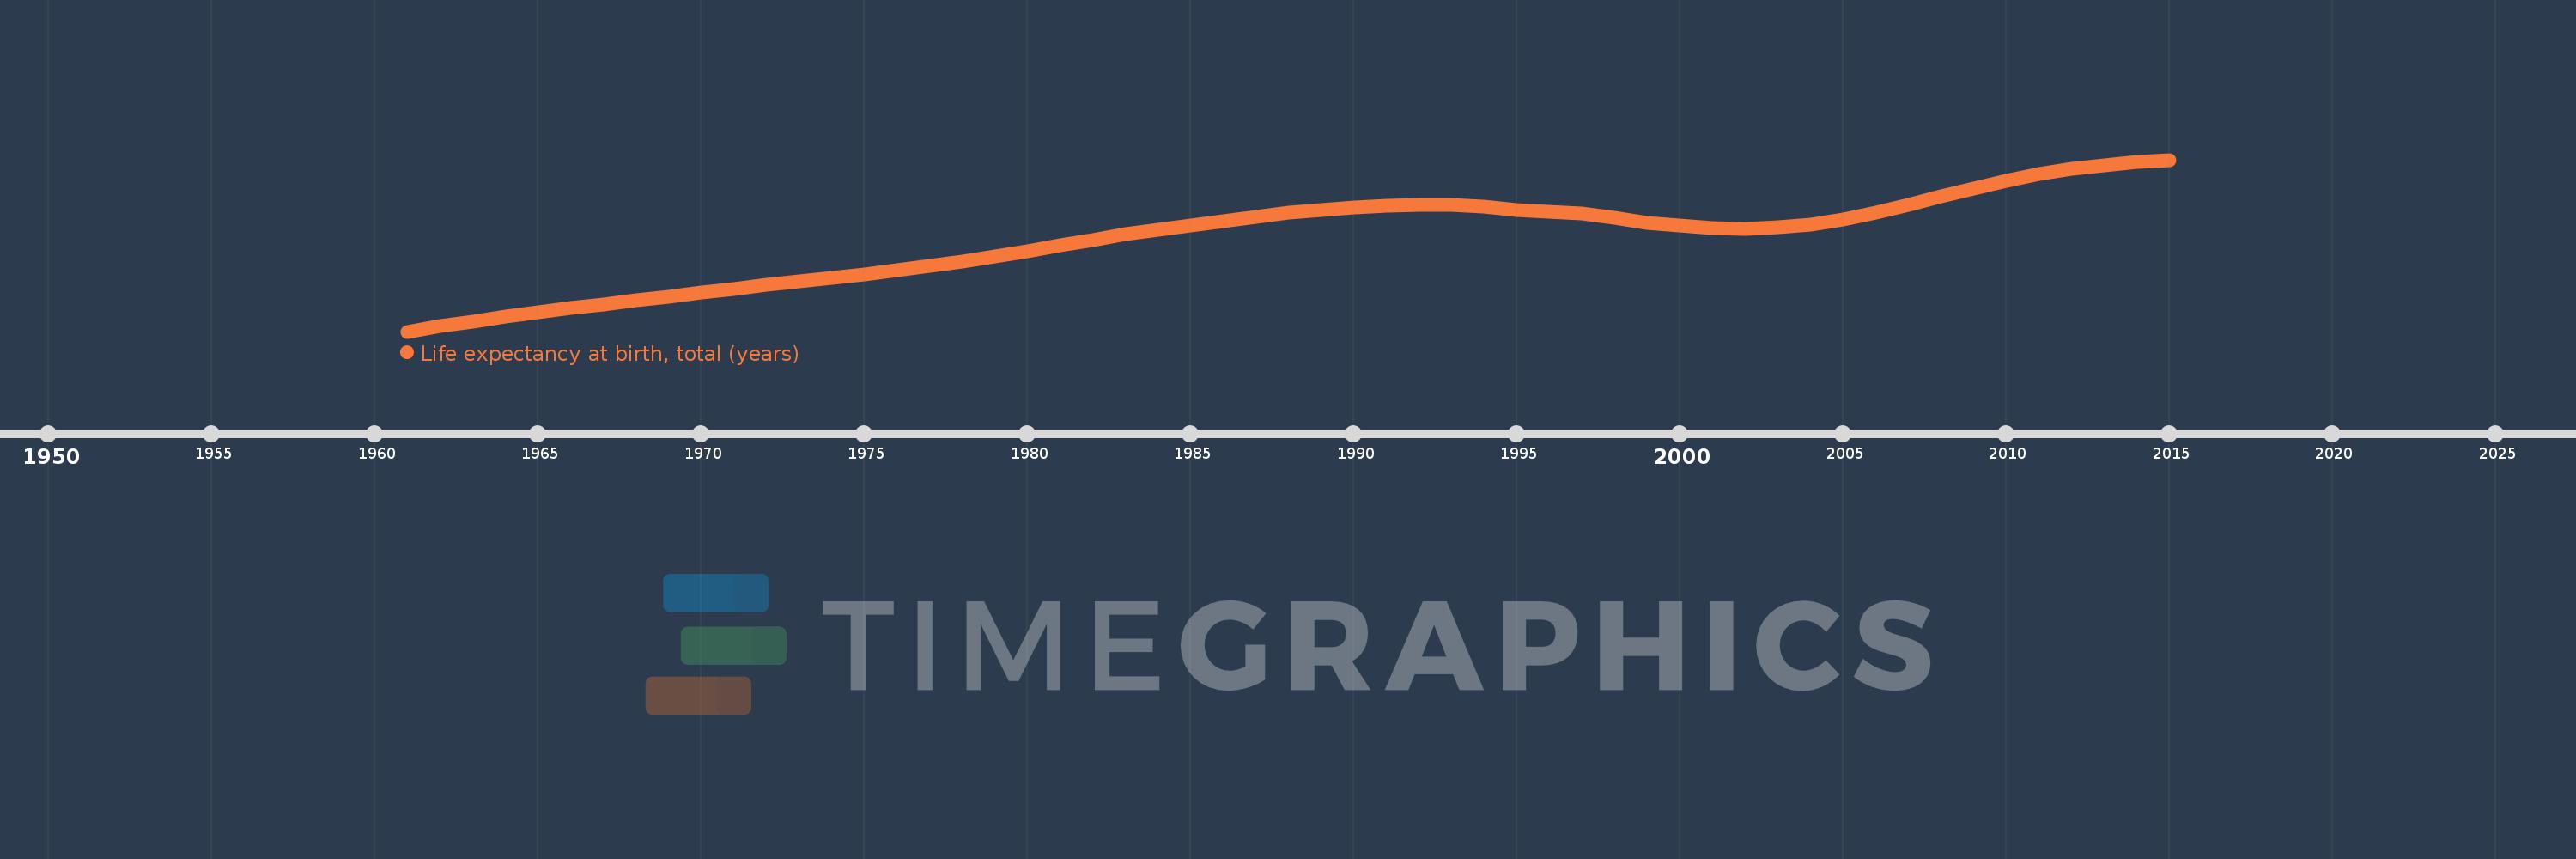
Life expectancy at birth, total (years)
2015,2014,2013,2012,2011,2010,2009,2008,2007,2006,2005,2004,2003,2002,2001,2000,1999,1998,1997,1996,1995,1994,1993,1992,1991,1990,1989,1988,1987,1986,1985,1984,1983,1982,1981,1980,1979,1978,1977,1976,1975,1974,1973,1972,1971,1970,1969,1968,1967,1966,1965,1964,1963,1962,1961
Estas estadísticas en otros países:
AfghanistanAlbaniaAlgeriaAngolaAntigua and BarbudaArab WorldArgentinaArmeniaArubaAustraliaAustriaAzerbaijanBahamas, TheBahrainBangladeshBarbadosBelarusBelgiumBelizeBeninBermudaBhutanBoliviaBosnia and HerzegovinaBotswanaBrazilBrunei DarussalamBulgariaBurkina FasoBurundiCabo VerdeCambodiaCameroonCanadaCaribbean small statesCentral African RepublicCentral Europe and the BalticsChadChannel IslandsChileChinaColombiaComorosCongo, Dem. Rep.Congo, Rep.Costa RicaCote d'IvoireCroatiaCubaCuracaoCyprusCzech RepublicDenmarkDjiboutiDominicaDominican RepublicEarly-demographic dividendEast Asia & PacificEast Asia & Pacific (excluding high income)East Asia & Pacific (IDA & IBRD countries)EcuadorEgypt, Arab Rep.El SalvadorEquatorial GuineaEritreaEstoniaEthiopiaEuro areaEurope & Central AsiaEurope & Central Asia (excluding high income)Europe & Central Asia (IDA & IBRD countries)European UnionFaroe IslandsFijiFinlandFragile and conflict affected situationsFranceFrench PolynesiaGabonGambia, TheGeorgiaGermanyGhanaGreeceGreenlandGrenadaGuamGuatemalaGuineaGuinea-BissauGuyanaHaitiHeavily indebted poor countries (HIPC)High incomeHondurasHong Kong SAR, ChinaHungaryIBRD onlyIcelandIDA & IBRD totalIDA blendIDA onlyIDA totalIndiaIndonesiaIran, Islamic Rep.IraqIrelandIsle of ManIsraelItalyJamaicaJapanJordanKazakhstanKenyaKiribatiKorea, Dem. People’s Rep.Korea, Rep.KosovoKuwaitKyrgyz RepublicLao PDRLate-demographic dividendLatin America & Caribbean Latin America & Caribbean (excluding high income)Latin America & the Caribbean (IDA & IBRD countries)LatviaLeast developed countries: UN classificationLebanonLesothoLiberiaLibyaLiechtensteinLithuaniaLow & middle incomeLow incomeLower middle incomeLuxembourgMacao SAR, ChinaMacedonia, FYRMadagascarMalawiMalaysiaMaldivesMaliMaltaMarshall IslandsMauritaniaMauritiusMexicoMicronesia, Fed. Sts.Middle East & North AfricaMiddle East & North Africa (excluding high income)Middle East & North Africa (IDA & IBRD countries)Middle incomeMoldovaMongoliaMontenegroMoroccoMozambiqueMyanmarNamibiaNepalNetherlandsNew CaledoniaNew ZealandNicaraguaNigerNigeriaNorth AmericaNorwayOECD membersOmanOther small statesPacific island small statesPakistanPalauPanamaPapua New GuineaParaguayPeruPhilippinesPolandPortugalPost-demographic dividendPre-demographic dividendPuerto RicoQatarRomaniaRussian FederationRwandaSamoaSan MarinoSao Tome and PrincipeSaudi ArabiaSenegalSerbiaSeychellesSierra LeoneSingaporeSint Maarten (Dutch part)Slovak RepublicSloveniaSmall statesSolomon IslandsSomaliaSouth AfricaSouth AsiaSouth Asia (IDA & IBRD)South SudanSpainSri LankaSt. Kitts and NevisSt. LuciaSt. Martin (French part)St. Vincent and the GrenadinesSub-Saharan Africa Sub-Saharan Africa (excluding high income)Sub-Saharan Africa (IDA & IBRD countries)SudanSurinameSwazilandSwedenSwitzerlandSyrian Arab RepublicTajikistanTanzaniaThailandTimor-LesteTogoTongaTrinidad and TobagoTunisiaTurkeyTurkmenistanUgandaUkraineUnited Arab EmiratesUnited KingdomUnited StatesUpper middle incomeUruguayUzbekistanVanuatuVenezuela, RBVietnamVirgin Islands (U.S.)West Bank and GazaWorldYemen, Rep.ZambiaZimbabwe línea de tiempo (timeline):
En esta escala de tiempo se presenta un gráfico de 1961 y 2015 de Other small states. Los datos de 1960 están ausentes. El número de observaciones reales por fecha: 55.
Fuente (nombre):
Indicadores del desarrollo mundial
Fuente (organización):
Derived from male and female life expectancy at birth from sources such as: (1) United Nations Population Division. World Population Prospects, (2) Census reports and other statistical publications from national statistical offices, (3) Eurostat: Demographic Statistics, (4) United Nations Statistical Division. Population and Vital Statistics Reprot (various years), (5) U.S. Census Bureau: International Database, and (6) Secretariat of the Pacific Community: Statistics and Demography Programme.
Categorías:
Health
Se ha actualizado:
23 abr 2017 año
Los indicadores de los cambios de valor en los últimos años
Mínimo:
51.342
1 ene 1961 año
Máximo:
66.447
1 ene 2015 año
A la fecha de observación
Valor
Cambio absoluto
El cambio con respecto al valor anterior
1 ene 1961 año
51.342
+51.342
0.0%
1 ene 1962 año
51.796
+0.454
0.88%
1 ene 1963 año
52.237
+0.442
0.85%
1 ene 1964 año
52.64
+0.402
0.77%
1 ene 1965 año
53.042
+0.402
0.76%
1 ene 1966 año
53.415
+0.373
0.7%
1 ene 1967 año
53.748
+0.333
0.62%
1 ene 1968 año
54.088
+0.34
0.63%
1 ene 1969 año
54.425
+0.337
0.62%
1 ene 1970 año
54.761
+0.336
0.62%
1 ene 1971 año
55.11
+0.349
0.64%
1 ene 1972 año
55.447
+0.337
0.61%
1 ene 1973 año
55.789
+0.342
0.62%
1 ene 1974 año
56.096
+0.306
0.55%
1 ene 1975 año
56.393
+0.298
0.53%
1 ene 1976 año
56.724
+0.331
0.59%
1 ene 1977 año
57.097
+0.373
0.66%
1 ene 1978 año
57.489
+0.391
0.69%
1 ene 1979 año
57.944
+0.455
0.79%
1 ene 1980 año
58.425
+0.481
0.83%
1 ene 1981 año
58.913
+0.487
0.83%
1 ene 1982 año
59.386
+0.474
0.8%
1 ene 1983 año
59.899
+0.513
0.86%
1 ene 1984 año
60.289
+0.39
0.65%
1 ene 1985 año
60.659
+0.37
0.61%
1 ene 1986 año
61.011
+0.352
0.58%
1 ene 1987 año
61.405
+0.394
0.65%
1 ene 1988 año
61.78
+0.376
0.61%
1 ene 1989 año
62.027
+0.246
0.4%
1 ene 1990 año
62.23
+0.203
0.33%
1 ene 1991 año
62.372
+0.142
0.23%
1 ene 1992 año
62.495
+0.123
0.2%
1 ene 1993 año
62.508
+0.014
0.02%
1 ene 1994 año
62.321
-0.187
-0.3%
1 ene 1995 año
62.044
-0.277
-0.44%
1 ene 1996 año
61.858
-0.187
-0.3%
1 ene 1997 año
61.703
-0.155
-0.25%
1 ene 1998 año
61.38
-0.322
-0.52%
1 ene 1999 año
60.929
-0.451
-0.73%
1 ene 2000 año
60.632
-0.298
-0.49%
1 ene 2001 año
60.453
-0.178
-0.29%
1 ene 2002 año
60.354
-0.099
-0.16%
1 ene 2003 año
60.489
+0.135
0.22%
1 ene 2004 año
60.737
+0.247
0.41%
1 ene 2005 año
61.199
+0.462
0.76%
1 ene 2006 año
61.805
+0.606
0.99%
1 ene 2007 año
62.476
+0.671
1.09%
1 ene 2008 año
63.214
+0.738
1.18%
1 ene 2009 año
63.949
+0.735
1.16%
1 ene 2010 año
64.629
+0.681
1.06%
1 ene 2011 año
65.182
+0.553
0.86%
1 ene 2012 año
65.619
+0.437
0.67%
1 ene 2013 año
65.945
+0.326
0.5%
1 ene 2014 año
66.236
+0.291
0.44%
1 ene 2015 año
66.447
+0.212
0.32%
Ranking de los países por los datos estadísticos actuales


Comentarios: