29
/es/
es
AIzaSyAYiBZKx7MnpbEhh9jyipgxe19OcubqV5w
April 1, 2024
267054
Trinidad and Tobago
TTO
true
2
1
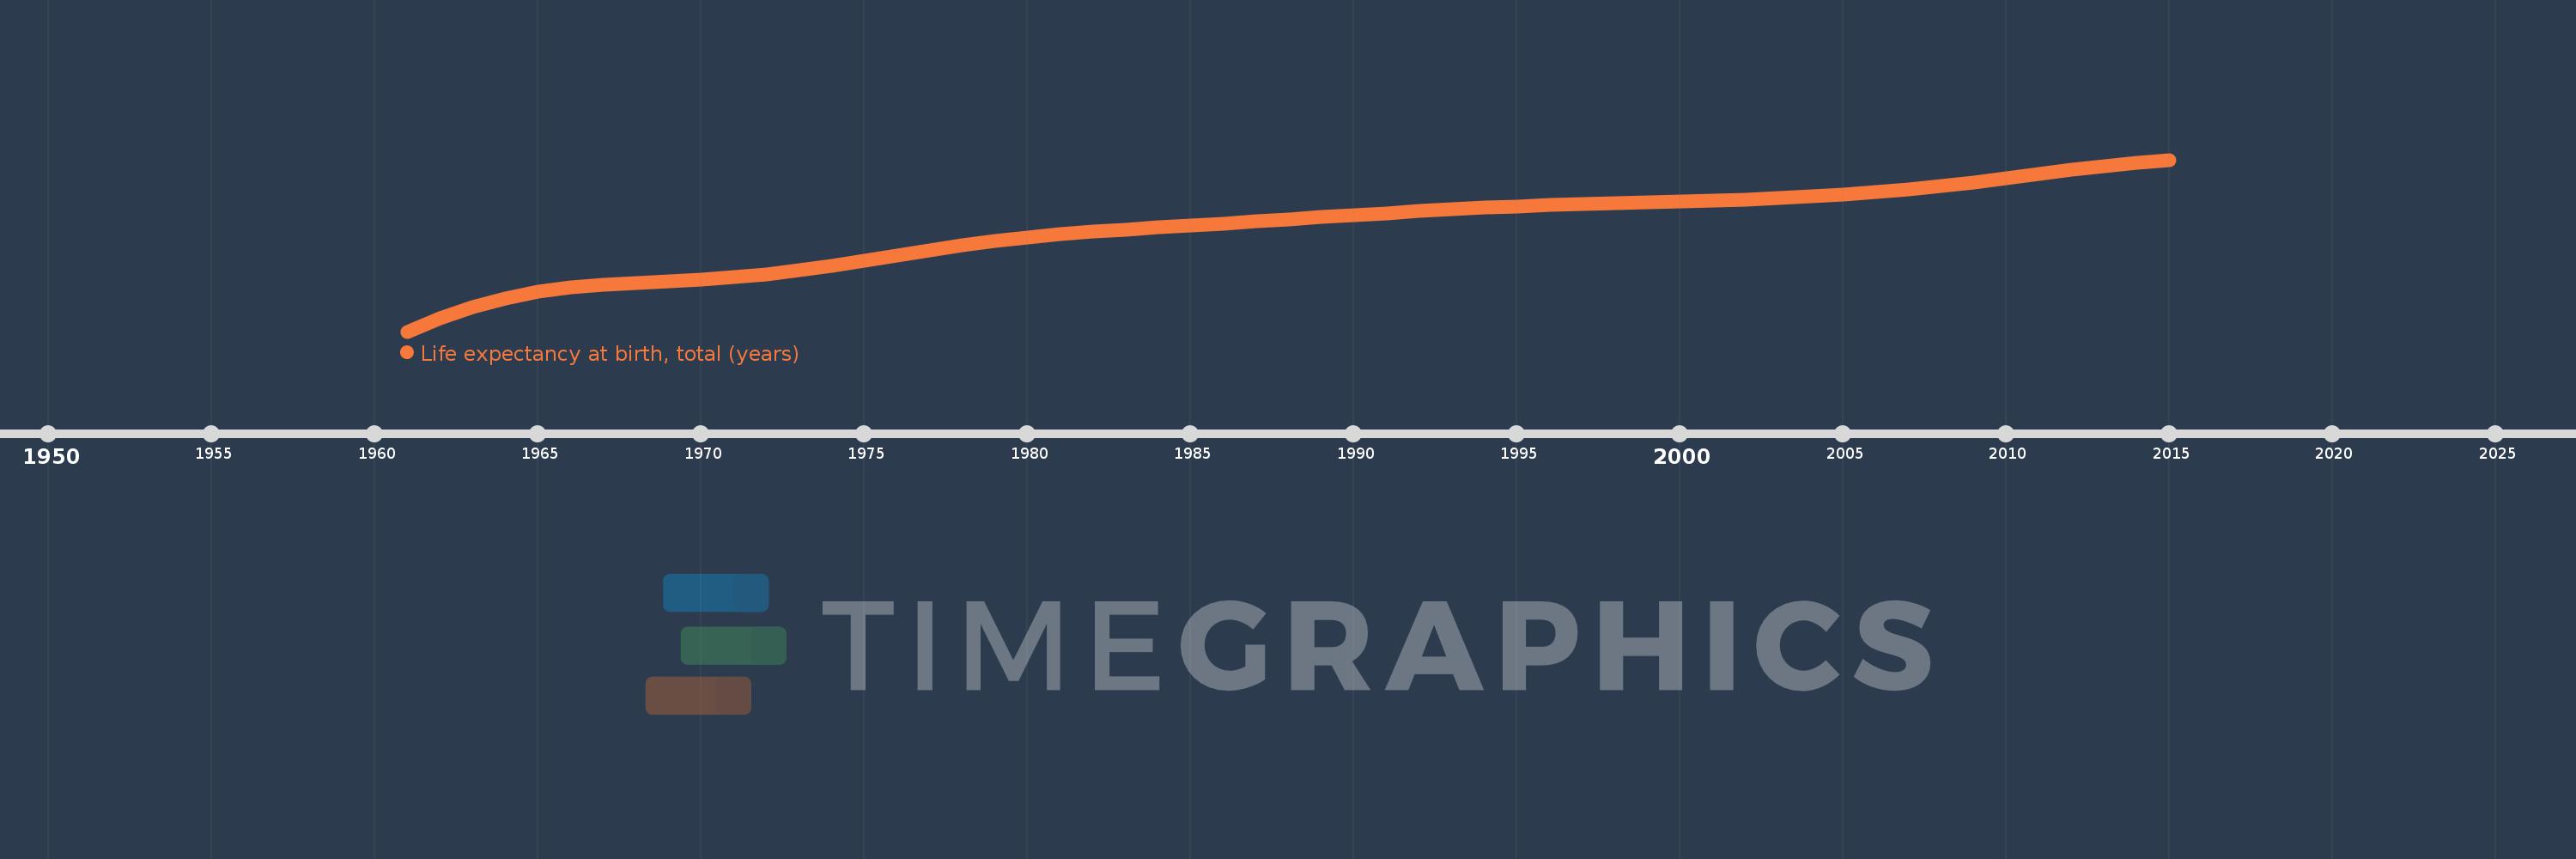
Life expectancy at birth, total (years)
2015,2014,2013,2012,2011,2010,2009,2008,2007,2006,2005,2004,2003,2002,2001,2000,1999,1998,1997,1996,1995,1994,1993,1992,1991,1990,1989,1988,1987,1986,1985,1984,1983,1982,1981,1980,1979,1978,1977,1976,1975,1974,1973,1972,1971,1970,1969,1968,1967,1966,1965,1964,1963,1962,1961
Estas estadísticas en otros países:
AfghanistanAlbaniaAlgeriaAngolaAntigua and BarbudaArab WorldArgentinaArmeniaArubaAustraliaAustriaAzerbaijanBahamas, TheBahrainBangladeshBarbadosBelarusBelgiumBelizeBeninBermudaBhutanBoliviaBosnia and HerzegovinaBotswanaBrazilBrunei DarussalamBulgariaBurkina FasoBurundiCabo VerdeCambodiaCameroonCanadaCaribbean small statesCentral African RepublicCentral Europe and the BalticsChadChannel IslandsChileChinaColombiaComorosCongo, Dem. Rep.Congo, Rep.Costa RicaCote d'IvoireCroatiaCubaCuracaoCyprusCzech RepublicDenmarkDjiboutiDominicaDominican RepublicEarly-demographic dividendEast Asia & PacificEast Asia & Pacific (excluding high income)East Asia & Pacific (IDA & IBRD countries)EcuadorEgypt, Arab Rep.El SalvadorEquatorial GuineaEritreaEstoniaEthiopiaEuro areaEurope & Central AsiaEurope & Central Asia (excluding high income)Europe & Central Asia (IDA & IBRD countries)European UnionFaroe IslandsFijiFinlandFragile and conflict affected situationsFranceFrench PolynesiaGabonGambia, TheGeorgiaGermanyGhanaGreeceGreenlandGrenadaGuamGuatemalaGuineaGuinea-BissauGuyanaHaitiHeavily indebted poor countries (HIPC)High incomeHondurasHong Kong SAR, ChinaHungaryIBRD onlyIcelandIDA & IBRD totalIDA blendIDA onlyIDA totalIndiaIndonesiaIran, Islamic Rep.IraqIrelandIsle of ManIsraelItalyJamaicaJapanJordanKazakhstanKenyaKiribatiKorea, Dem. People’s Rep.Korea, Rep.KosovoKuwaitKyrgyz RepublicLao PDRLate-demographic dividendLatin America & Caribbean Latin America & Caribbean (excluding high income)Latin America & the Caribbean (IDA & IBRD countries)LatviaLeast developed countries: UN classificationLebanonLesothoLiberiaLibyaLiechtensteinLithuaniaLow & middle incomeLow incomeLower middle incomeLuxembourgMacao SAR, ChinaMacedonia, FYRMadagascarMalawiMalaysiaMaldivesMaliMaltaMarshall IslandsMauritaniaMauritiusMexicoMicronesia, Fed. Sts.Middle East & North AfricaMiddle East & North Africa (excluding high income)Middle East & North Africa (IDA & IBRD countries)Middle incomeMoldovaMongoliaMontenegroMoroccoMozambiqueMyanmarNamibiaNepalNetherlandsNew CaledoniaNew ZealandNicaraguaNigerNigeriaNorth AmericaNorwayOECD membersOmanOther small statesPacific island small statesPakistanPalauPanamaPapua New GuineaParaguayPeruPhilippinesPolandPortugalPost-demographic dividendPre-demographic dividendPuerto RicoQatarRomaniaRussian FederationRwandaSamoaSan MarinoSao Tome and PrincipeSaudi ArabiaSenegalSerbiaSeychellesSierra LeoneSingaporeSint Maarten (Dutch part)Slovak RepublicSloveniaSmall statesSolomon IslandsSomaliaSouth AfricaSouth AsiaSouth Asia (IDA & IBRD)South SudanSpainSri LankaSt. Kitts and NevisSt. LuciaSt. Martin (French part)St. Vincent and the GrenadinesSub-Saharan Africa Sub-Saharan Africa (excluding high income)Sub-Saharan Africa (IDA & IBRD countries)SudanSurinameSwazilandSwedenSwitzerlandSyrian Arab RepublicTajikistanTanzaniaThailandTimor-LesteTogoTongaTrinidad and TobagoTunisiaTurkeyTurkmenistanUgandaUkraineUnited Arab EmiratesUnited KingdomUnited StatesUpper middle incomeUruguayUzbekistanVanuatuVenezuela, RBVietnamVirgin Islands (U.S.)West Bank and GazaWorldYemen, Rep.ZambiaZimbabwe línea de tiempo (timeline):
En esta escala de tiempo se presenta un gráfico de 1961 y 2015 de Trinidad and Tobago. Los datos de 1960 están ausentes. El número de observaciones reales por fecha: 55.
Fuente (nombre):
Indicadores del desarrollo mundial
Fuente (organización):
Derived from male and female life expectancy at birth from sources such as: (1) United Nations Population Division. World Population Prospects, (2) Census reports and other statistical publications from national statistical offices, (3) Eurostat: Demographic Statistics, (4) United Nations Statistical Division. Population and Vital Statistics Reprot (various years), (5) U.S. Census Bureau: International Database, and (6) Secretariat of the Pacific Community: Statistics and Demography Programme.
Categorías:
Health
Se ha actualizado:
23 abr 2017 año
Los indicadores de los cambios de valor en los últimos años
Mínimo:
62.658
1 ene 1961 año
Máximo:
70.441
1 ene 2015 año
A la fecha de observación
Valor
Cambio absoluto
El cambio con respecto al valor anterior
1 ene 1961 año
62.658
+62.658
0.0%
1 ene 1962 año
63.254
+0.596
0.95%
1 ene 1963 año
63.76
+0.506
0.8%
1 ene 1964 año
64.161
+0.401
0.63%
1 ene 1965 año
64.456
+0.294
0.46%
1 ene 1966 año
64.652
+0.196
0.3%
1 ene 1967 año
64.77
+0.118
0.18%
1 ene 1968 año
64.848
+0.078
0.12%
1 ene 1969 año
64.918
+0.07
0.11%
1 ene 1970 año
65.0
+0.082
0.13%
1 ene 1971 año
65.111
+0.111
0.17%
1 ene 1972 año
65.26
+0.15
0.23%
1 ene 1973 año
65.443
+0.182
0.28%
1 ene 1974 año
65.647
+0.204
0.31%
1 ene 1975 año
65.871
+0.224
0.34%
1 ene 1976 año
66.105
+0.234
0.35%
1 ene 1977 año
66.337
+0.233
0.35%
1 ene 1978 año
66.556
+0.219
0.33%
1 ene 1979 año
66.752
+0.196
0.29%
1 ene 1980 año
66.921
+0.169
0.25%
1 ene 1981 año
67.063
+0.142
0.21%
1 ene 1982 año
67.18
+0.117
0.17%
1 ene 1983 año
67.281
+0.101
0.15%
1 ene 1984 año
67.376
+0.095
0.14%
1 ene 1985 año
67.466
+0.09
0.13%
1 ene 1986 año
67.557
+0.09
0.13%
1 ene 1987 año
67.649
+0.093
0.14%
1 ene 1988 año
67.743
+0.094
0.14%
1 ene 1989 año
67.837
+0.094
0.14%
1 ene 1990 año
67.931
+0.094
0.14%
1 ene 1991 año
68.023
+0.092
0.14%
1 ene 1992 año
68.111
+0.088
0.13%
1 ene 1993 año
68.192
+0.081
0.12%
1 ene 1994 año
68.264
+0.072
0.11%
1 ene 1995 año
68.328
+0.064
0.09%
1 ene 1996 año
68.384
+0.056
0.08%
1 ene 1997 año
68.431
+0.047
0.07%
1 ene 1998 año
68.473
+0.042
0.06%
1 ene 1999 año
68.511
+0.039
0.06%
1 ene 2000 año
68.552
+0.04
0.06%
1 ene 2001 año
68.596
+0.045
0.07%
1 ene 2002 año
68.649
+0.053
0.08%
1 ene 2003 año
68.71
+0.061
0.09%
1 ene 2004 año
68.784
+0.074
0.11%
1 ene 2005 año
68.872
+0.088
0.13%
1 ene 2006 año
68.979
+0.107
0.16%
1 ene 2007 año
69.108
+0.129
0.19%
1 ene 2008 año
69.26
+0.151
0.22%
1 ene 2009 año
69.429
+0.169
0.24%
1 ene 2010 año
69.611
+0.182
0.26%
1 ene 2011 año
69.798
+0.187
0.27%
1 ene 2012 año
69.98
+0.183
0.26%
1 ene 2013 año
70.151
+0.171
0.24%
1 ene 2014 año
70.305
+0.154
0.22%
1 ene 2015 año
70.441
+0.135
0.19%
Ranking de los países por los datos estadísticos actuales


Comentarios: