29
/es/
es
AIzaSyAYiBZKx7MnpbEhh9jyipgxe19OcubqV5w
April 1, 2024
132207
Fiji
FJI
true
2
1
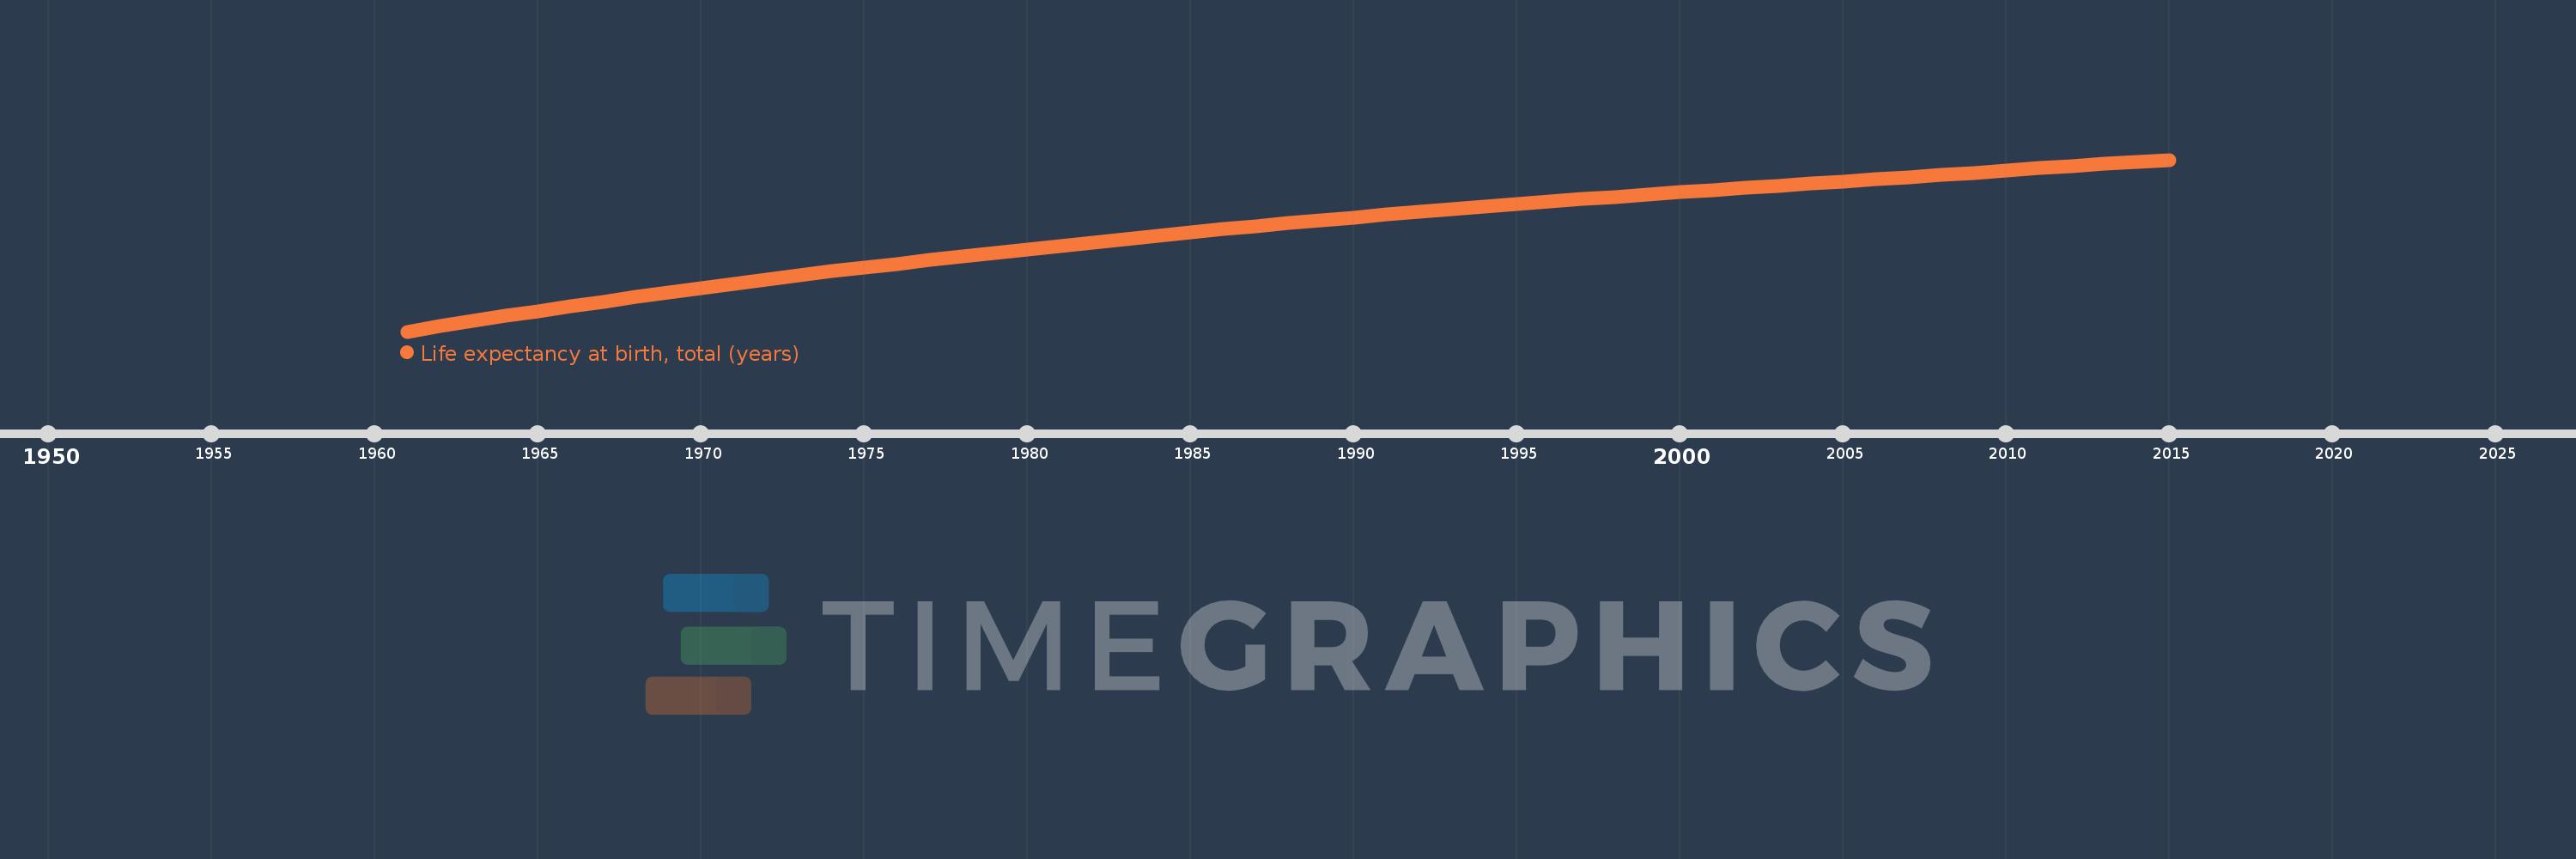
Life expectancy at birth, total (years)
2015,2014,2013,2012,2011,2010,2009,2008,2007,2006,2005,2004,2003,2002,2001,2000,1999,1998,1997,1996,1995,1994,1993,1992,1991,1990,1989,1988,1987,1986,1985,1984,1983,1982,1981,1980,1979,1978,1977,1976,1975,1974,1973,1972,1971,1970,1969,1968,1967,1966,1965,1964,1963,1962,1961
Estas estadísticas en otros países:
AfghanistanAlbaniaAlgeriaAngolaAntigua and BarbudaArab WorldArgentinaArmeniaArubaAustraliaAustriaAzerbaijanBahamas, TheBahrainBangladeshBarbadosBelarusBelgiumBelizeBeninBermudaBhutanBoliviaBosnia and HerzegovinaBotswanaBrazilBrunei DarussalamBulgariaBurkina FasoBurundiCabo VerdeCambodiaCameroonCanadaCaribbean small statesCentral African RepublicCentral Europe and the BalticsChadChannel IslandsChileChinaColombiaComorosCongo, Dem. Rep.Congo, Rep.Costa RicaCote d'IvoireCroatiaCubaCuracaoCyprusCzech RepublicDenmarkDjiboutiDominicaDominican RepublicEarly-demographic dividendEast Asia & PacificEast Asia & Pacific (excluding high income)East Asia & Pacific (IDA & IBRD countries)EcuadorEgypt, Arab Rep.El SalvadorEquatorial GuineaEritreaEstoniaEthiopiaEuro areaEurope & Central AsiaEurope & Central Asia (excluding high income)Europe & Central Asia (IDA & IBRD countries)European UnionFaroe IslandsFijiFinlandFragile and conflict affected situationsFranceFrench PolynesiaGabonGambia, TheGeorgiaGermanyGhanaGreeceGreenlandGrenadaGuamGuatemalaGuineaGuinea-BissauGuyanaHaitiHeavily indebted poor countries (HIPC)High incomeHondurasHong Kong SAR, ChinaHungaryIBRD onlyIcelandIDA & IBRD totalIDA blendIDA onlyIDA totalIndiaIndonesiaIran, Islamic Rep.IraqIrelandIsle of ManIsraelItalyJamaicaJapanJordanKazakhstanKenyaKiribatiKorea, Dem. People’s Rep.Korea, Rep.KosovoKuwaitKyrgyz RepublicLao PDRLate-demographic dividendLatin America & Caribbean Latin America & Caribbean (excluding high income)Latin America & the Caribbean (IDA & IBRD countries)LatviaLeast developed countries: UN classificationLebanonLesothoLiberiaLibyaLiechtensteinLithuaniaLow & middle incomeLow incomeLower middle incomeLuxembourgMacao SAR, ChinaMacedonia, FYRMadagascarMalawiMalaysiaMaldivesMaliMaltaMarshall IslandsMauritaniaMauritiusMexicoMicronesia, Fed. Sts.Middle East & North AfricaMiddle East & North Africa (excluding high income)Middle East & North Africa (IDA & IBRD countries)Middle incomeMoldovaMongoliaMontenegroMoroccoMozambiqueMyanmarNamibiaNepalNetherlandsNew CaledoniaNew ZealandNicaraguaNigerNigeriaNorth AmericaNorwayOECD membersOmanOther small statesPacific island small statesPakistanPalauPanamaPapua New GuineaParaguayPeruPhilippinesPolandPortugalPost-demographic dividendPre-demographic dividendPuerto RicoQatarRomaniaRussian FederationRwandaSamoaSan MarinoSao Tome and PrincipeSaudi ArabiaSenegalSerbiaSeychellesSierra LeoneSingaporeSint Maarten (Dutch part)Slovak RepublicSloveniaSmall statesSolomon IslandsSomaliaSouth AfricaSouth AsiaSouth Asia (IDA & IBRD)South SudanSpainSri LankaSt. Kitts and NevisSt. LuciaSt. Martin (French part)St. Vincent and the GrenadinesSub-Saharan Africa Sub-Saharan Africa (excluding high income)Sub-Saharan Africa (IDA & IBRD countries)SudanSurinameSwazilandSwedenSwitzerlandSyrian Arab RepublicTajikistanTanzaniaThailandTimor-LesteTogoTongaTrinidad and TobagoTunisiaTurkeyTurkmenistanUgandaUkraineUnited Arab EmiratesUnited KingdomUnited StatesUpper middle incomeUruguayUzbekistanVanuatuVenezuela, RBVietnamVirgin Islands (U.S.)West Bank and GazaWorldYemen, Rep.ZambiaZimbabwe línea de tiempo (timeline):
En esta escala de tiempo se presenta un gráfico de 1961 y 2015 de Fiji. Los datos de 1960 están ausentes. El número de observaciones reales por fecha: 55.
Fuente (nombre):
Indicadores del desarrollo mundial
Fuente (organización):
Derived from male and female life expectancy at birth from sources such as: (1) United Nations Population Division. World Population Prospects, (2) Census reports and other statistical publications from national statistical offices, (3) Eurostat: Demographic Statistics, (4) United Nations Statistical Division. Population and Vital Statistics Reprot (various years), (5) U.S. Census Bureau: International Database, and (6) Secretariat of the Pacific Community: Statistics and Demography Programme.
Categorías:
Health
Se ha actualizado:
23 abr 2017 año
Los indicadores de los cambios de valor en los últimos años
Mínimo:
55.958
1 ene 1961 año
Máximo:
70.089
1 ene 2015 año
A la fecha de observación
Valor
Cambio absoluto
El cambio con respecto al valor anterior
1 ene 1961 año
55.958
+55.958
0.0%
1 ene 1962 año
56.393
+0.434
0.78%
1 ene 1963 año
56.817
+0.425
0.75%
1 ene 1964 año
57.232
+0.415
0.73%
1 ene 1965 año
57.639
+0.407
0.71%
1 ene 1966 año
58.036
+0.397
0.69%
1 ene 1967 año
58.426
+0.39
0.67%
1 ene 1968 año
58.808
+0.382
0.65%
1 ene 1969 año
59.182
+0.374
0.64%
1 ene 1970 año
59.549
+0.366
0.62%
1 ene 1971 año
59.906
+0.358
0.6%
1 ene 1972 año
60.252
+0.346
0.58%
1 ene 1973 año
60.588
+0.336
0.56%
1 ene 1974 año
60.912
+0.324
0.53%
1 ene 1975 año
61.226
+0.314
0.52%
1 ene 1976 año
61.532
+0.306
0.5%
1 ene 1977 año
61.833
+0.301
0.49%
1 ene 1978 año
62.13
+0.297
0.48%
1 ene 1979 año
62.424
+0.294
0.47%
1 ene 1980 año
62.718
+0.294
0.47%
1 ene 1981 año
63.009
+0.291
0.46%
1 ene 1982 año
63.296
+0.288
0.46%
1 ene 1983 año
63.578
+0.282
0.45%
1 ene 1984 año
63.853
+0.275
0.43%
1 ene 1985 año
64.12
+0.267
0.42%
1 ene 1986 año
64.379
+0.259
0.4%
1 ene 1987 año
64.63
+0.251
0.39%
1 ene 1988 año
64.873
+0.244
0.38%
1 ene 1989 año
65.111
+0.238
0.37%
1 ene 1990 año
65.344
+0.233
0.36%
1 ene 1991 año
65.571
+0.227
0.35%
1 ene 1992 año
65.793
+0.222
0.34%
1 ene 1993 año
66.011
+0.218
0.33%
1 ene 1994 año
66.224
+0.213
0.32%
1 ene 1995 año
66.434
+0.209
0.32%
1 ene 1996 año
66.639
+0.205
0.31%
1 ene 1997 año
66.84
+0.201
0.3%
1 ene 1998 año
67.038
+0.197
0.3%
1 ene 1999 año
67.231
+0.193
0.29%
1 ene 2000 año
67.42
+0.189
0.28%
1 ene 2001 año
67.606
+0.186
0.28%
1 ene 2002 año
67.788
+0.182
0.27%
1 ene 2003 año
67.967
+0.179
0.26%
1 ene 2004 año
68.143
+0.176
0.26%
1 ene 2005 año
68.318
+0.175
0.26%
1 ene 2006 año
68.492
+0.174
0.25%
1 ene 2007 año
68.667
+0.175
0.26%
1 ene 2008 año
68.843
+0.177
0.26%
1 ene 2009 año
69.022
+0.179
0.26%
1 ene 2010 año
69.203
+0.181
0.26%
1 ene 2011 año
69.384
+0.182
0.26%
1 ene 2012 año
69.565
+0.181
0.26%
1 ene 2013 año
69.743
+0.178
0.26%
1 ene 2014 año
69.918
+0.175
0.25%
1 ene 2015 año
70.089
+0.171
0.24%
Ranking de los países por los datos estadísticos actuales


Comentarios: