29
/es/
es
AIzaSyAYiBZKx7MnpbEhh9jyipgxe19OcubqV5w
April 1, 2024
203150
Mozambique
MOZ
true
2
1
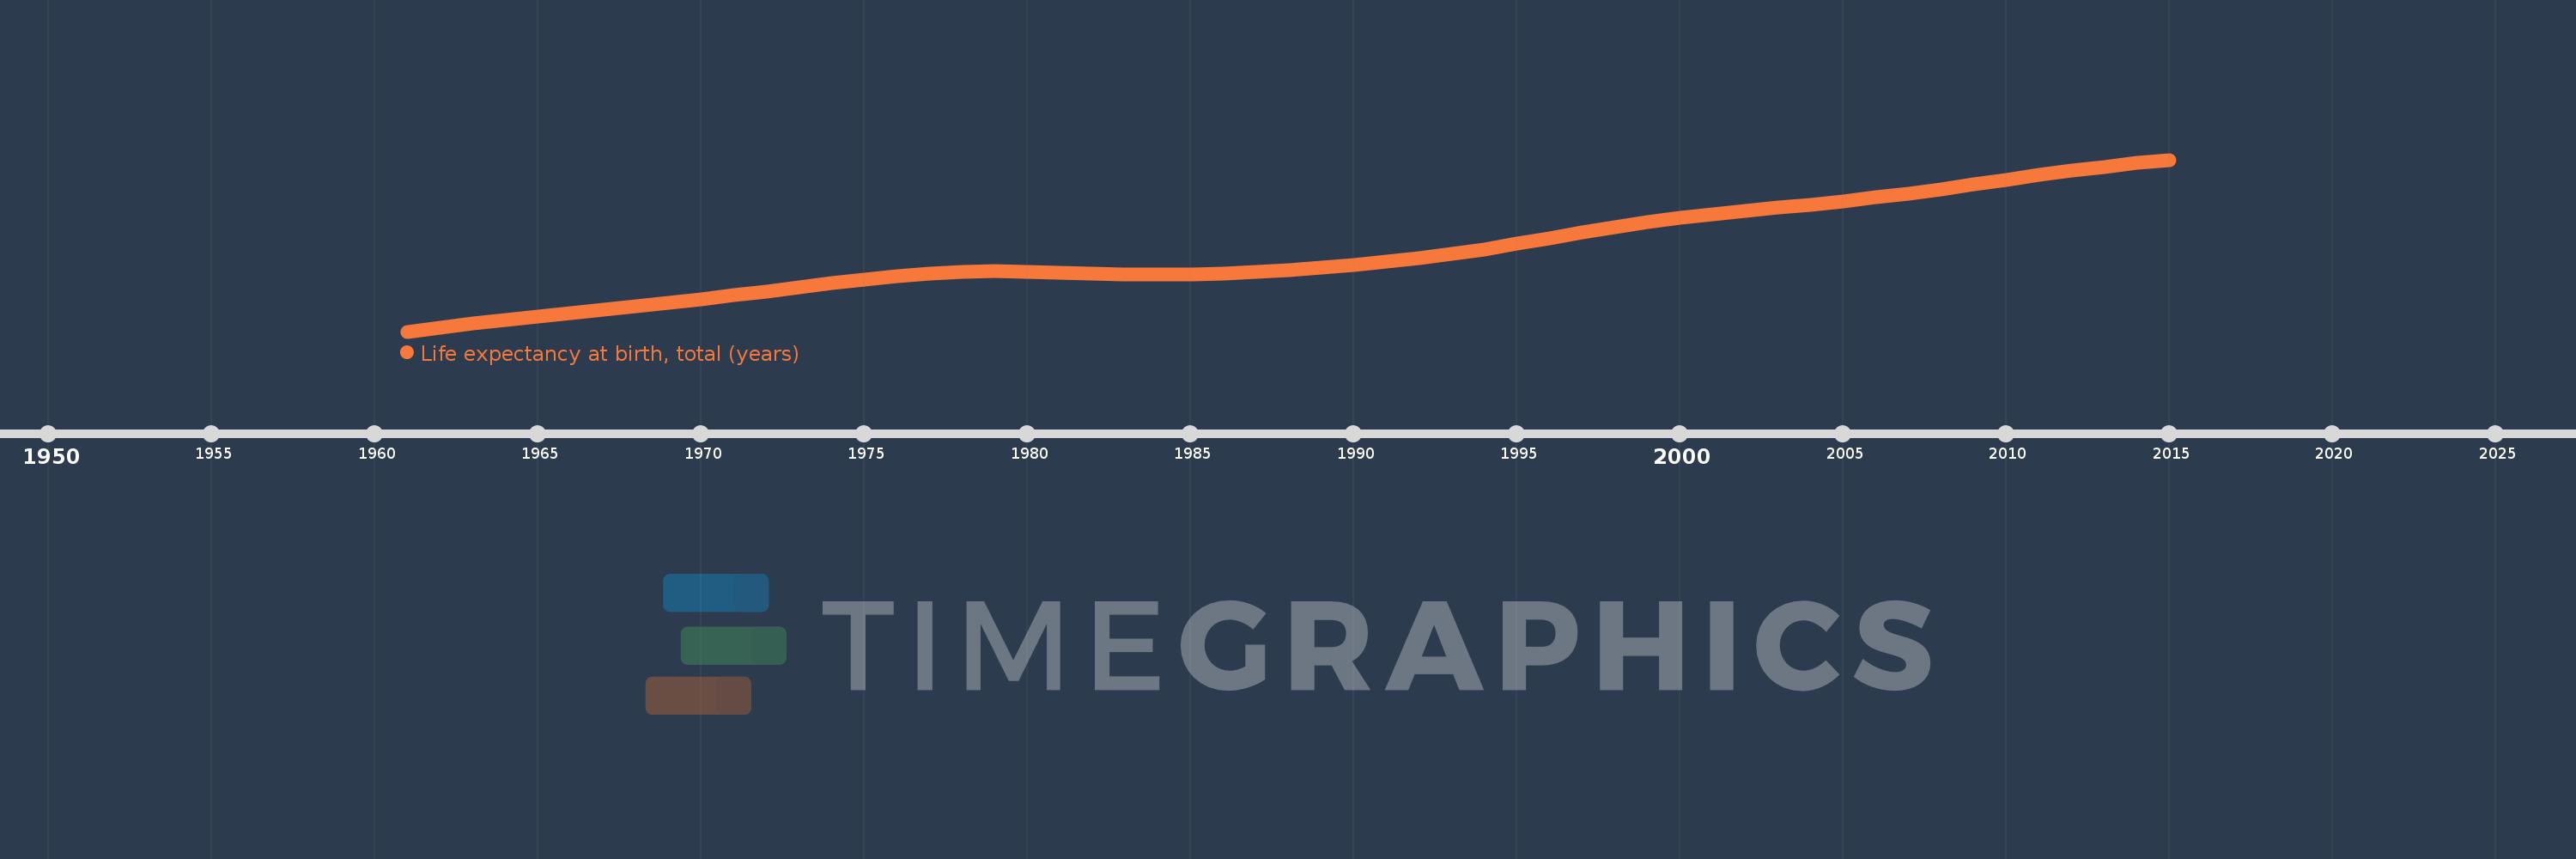
Life expectancy at birth, total (years)
2015,2014,2013,2012,2011,2010,2009,2008,2007,2006,2005,2004,2003,2002,2001,2000,1999,1998,1997,1996,1995,1994,1993,1992,1991,1990,1989,1988,1987,1986,1985,1984,1983,1982,1981,1980,1979,1978,1977,1976,1975,1974,1973,1972,1971,1970,1969,1968,1967,1966,1965,1964,1963,1962,1961
Estas estadísticas en otros países:
AfghanistanAlbaniaAlgeriaAngolaAntigua and BarbudaArab WorldArgentinaArmeniaArubaAustraliaAustriaAzerbaijanBahamas, TheBahrainBangladeshBarbadosBelarusBelgiumBelizeBeninBermudaBhutanBoliviaBosnia and HerzegovinaBotswanaBrazilBrunei DarussalamBulgariaBurkina FasoBurundiCabo VerdeCambodiaCameroonCanadaCaribbean small statesCentral African RepublicCentral Europe and the BalticsChadChannel IslandsChileChinaColombiaComorosCongo, Dem. Rep.Congo, Rep.Costa RicaCote d'IvoireCroatiaCubaCuracaoCyprusCzech RepublicDenmarkDjiboutiDominicaDominican RepublicEarly-demographic dividendEast Asia & PacificEast Asia & Pacific (excluding high income)East Asia & Pacific (IDA & IBRD countries)EcuadorEgypt, Arab Rep.El SalvadorEquatorial GuineaEritreaEstoniaEthiopiaEuro areaEurope & Central AsiaEurope & Central Asia (excluding high income)Europe & Central Asia (IDA & IBRD countries)European UnionFaroe IslandsFijiFinlandFragile and conflict affected situationsFranceFrench PolynesiaGabonGambia, TheGeorgiaGermanyGhanaGreeceGreenlandGrenadaGuamGuatemalaGuineaGuinea-BissauGuyanaHaitiHeavily indebted poor countries (HIPC)High incomeHondurasHong Kong SAR, ChinaHungaryIBRD onlyIcelandIDA & IBRD totalIDA blendIDA onlyIDA totalIndiaIndonesiaIran, Islamic Rep.IraqIrelandIsle of ManIsraelItalyJamaicaJapanJordanKazakhstanKenyaKiribatiKorea, Dem. People’s Rep.Korea, Rep.KosovoKuwaitKyrgyz RepublicLao PDRLate-demographic dividendLatin America & Caribbean Latin America & Caribbean (excluding high income)Latin America & the Caribbean (IDA & IBRD countries)LatviaLeast developed countries: UN classificationLebanonLesothoLiberiaLibyaLiechtensteinLithuaniaLow & middle incomeLow incomeLower middle incomeLuxembourgMacao SAR, ChinaMacedonia, FYRMadagascarMalawiMalaysiaMaldivesMaliMaltaMarshall IslandsMauritaniaMauritiusMexicoMicronesia, Fed. Sts.Middle East & North AfricaMiddle East & North Africa (excluding high income)Middle East & North Africa (IDA & IBRD countries)Middle incomeMoldovaMongoliaMontenegroMoroccoMozambiqueMyanmarNamibiaNepalNetherlandsNew CaledoniaNew ZealandNicaraguaNigerNigeriaNorth AmericaNorwayOECD membersOmanOther small statesPacific island small statesPakistanPalauPanamaPapua New GuineaParaguayPeruPhilippinesPolandPortugalPost-demographic dividendPre-demographic dividendPuerto RicoQatarRomaniaRussian FederationRwandaSamoaSan MarinoSao Tome and PrincipeSaudi ArabiaSenegalSerbiaSeychellesSierra LeoneSingaporeSint Maarten (Dutch part)Slovak RepublicSloveniaSmall statesSolomon IslandsSomaliaSouth AfricaSouth AsiaSouth Asia (IDA & IBRD)South SudanSpainSri LankaSt. Kitts and NevisSt. LuciaSt. Martin (French part)St. Vincent and the GrenadinesSub-Saharan Africa Sub-Saharan Africa (excluding high income)Sub-Saharan Africa (IDA & IBRD countries)SudanSurinameSwazilandSwedenSwitzerlandSyrian Arab RepublicTajikistanTanzaniaThailandTimor-LesteTogoTongaTrinidad and TobagoTunisiaTurkeyTurkmenistanUgandaUkraineUnited Arab EmiratesUnited KingdomUnited StatesUpper middle incomeUruguayUzbekistanVanuatuVenezuela, RBVietnamVirgin Islands (U.S.)West Bank and GazaWorldYemen, Rep.ZambiaZimbabwe línea de tiempo (timeline):
En esta escala de tiempo se presenta un gráfico de 1961 y 2015 de Mozambique. Los datos de 1960 están ausentes. El número de observaciones reales por fecha: 55.
Fuente (nombre):
Indicadores del desarrollo mundial
Fuente (organización):
Derived from male and female life expectancy at birth from sources such as: (1) United Nations Population Division. World Population Prospects, (2) Census reports and other statistical publications from national statistical offices, (3) Eurostat: Demographic Statistics, (4) United Nations Statistical Division. Population and Vital Statistics Reprot (various years), (5) U.S. Census Bureau: International Database, and (6) Secretariat of the Pacific Community: Statistics and Demography Programme.
Categorías:
Health
Se ha actualizado:
23 abr 2017 año
Los indicadores de los cambios de valor en los últimos años
Mínimo:
35.004
1 ene 1961 año
Máximo:
55.026
1 ene 2015 año
A la fecha de observación
Valor
Cambio absoluto
El cambio con respecto al valor anterior
1 ene 1961 año
35.004
+35.004
0.0%
1 ene 1962 año
35.467
+0.463
1.32%
1 ene 1963 año
35.912
+0.446
1.26%
1 ene 1964 año
36.339
+0.427
1.19%
1 ene 1965 año
36.749
+0.41
1.13%
1 ene 1966 año
37.149
+0.4
1.09%
1 ene 1967 año
37.548
+0.398
1.07%
1 ene 1968 año
37.954
+0.406
1.08%
1 ene 1969 año
38.371
+0.417
1.1%
1 ene 1970 año
38.798
+0.428
1.11%
1 ene 1971 año
39.242
+0.444
1.14%
1 ene 1972 año
39.706
+0.464
1.18%
1 ene 1973 año
40.181
+0.475
1.2%
1 ene 1974 año
40.651
+0.47
1.17%
1 ene 1975 año
41.097
+0.446
1.1%
1 ene 1976 año
41.487
+0.389
0.95%
1 ene 1977 año
41.78
+0.293
0.71%
1 ene 1978 año
41.961
+0.181
0.43%
1 ene 1979 año
42.029
+0.068
0.16%
1 ene 1980 año
41.997
-0.032
-0.08%
1 ene 1981 año
41.896
-0.101
-0.24%
1 ene 1982 año
41.768
-0.128
-0.3%
1 ene 1983 año
41.662
-0.106
-0.25%
1 ene 1984 año
41.615
-0.046
-0.11%
1 ene 1985 año
41.651
+0.035
0.08%
1 ene 1986 año
41.772
+0.122
0.29%
1 ene 1987 año
41.968
+0.195
0.47%
1 ene 1988 año
42.21
+0.242
0.58%
1 ene 1989 año
42.482
+0.272
0.64%
1 ene 1990 año
42.782
+0.3
0.71%
1 ene 1991 año
43.126
+0.344
0.8%
1 ene 1992 año
43.537
+0.411
0.95%
1 ene 1993 año
44.029
+0.491
1.13%
1 ene 1994 año
44.598
+0.569
1.29%
1 ene 1995 año
45.231
+0.634
1.42%
1 ene 1996 año
45.899
+0.668
1.48%
1 ene 1997 año
46.563
+0.665
1.45%
1 ene 1998 año
47.19
+0.627
1.35%
1 ene 1999 año
47.757
+0.567
1.2%
1 ene 2000 año
48.255
+0.498
1.04%
1 ene 2001 año
48.687
+0.432
0.89%
1 ene 2002 año
49.07
+0.384
0.79%
1 ene 2003 año
49.436
+0.366
0.75%
1 ene 2004 año
49.812
+0.376
0.76%
1 ene 2005 año
50.21
+0.398
0.8%
1 ene 2006 año
50.642
+0.432
0.86%
1 ene 2007 año
51.115
+0.474
0.94%
1 ene 2008 año
51.622
+0.507
0.99%
1 ene 2009 año
52.151
+0.528
1.02%
1 ene 2010 año
52.691
+0.541
1.04%
1 ene 2011 año
53.227
+0.536
1.02%
1 ene 2012 año
53.738
+0.511
0.96%
1 ene 2013 año
54.212
+0.474
0.88%
1 ene 2014 año
54.642
+0.429
0.79%
1 ene 2015 año
55.026
+0.384
0.7%
Ranking de los países por los datos estadísticos actuales


Comentarios: