29
/es/
es
AIzaSyAYiBZKx7MnpbEhh9jyipgxe19OcubqV5w
April 1, 2024
52306
North America
NAC
false
2
1
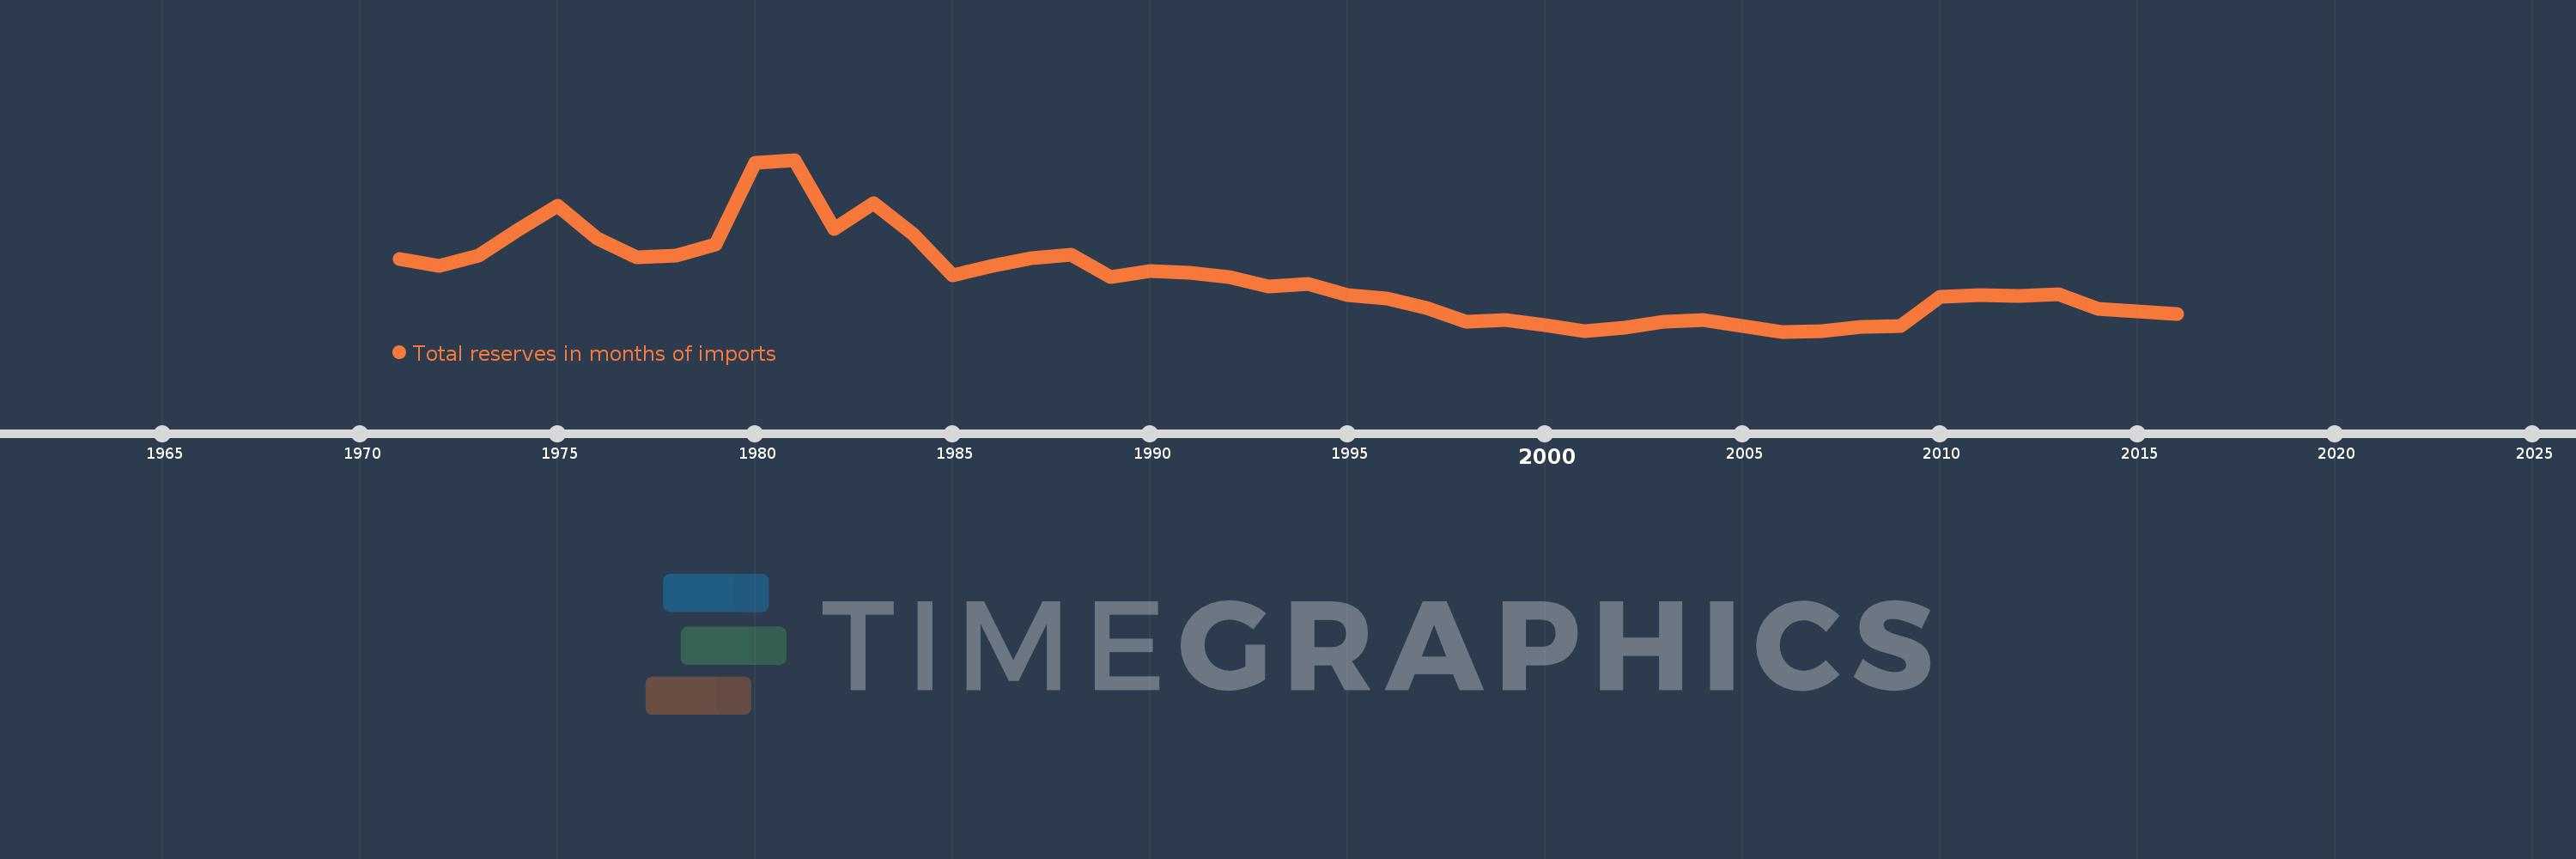
Total reserves in months of imports
2016,2015,2014,2013,2012,2011,2010,2009,2008,2007,2006,2005,2004,2003,2002,2001,2000,1999,1998,1997,1996,1995,1994,1993,1992,1991,1990,1989,1988,1987,1986,1985,1984,1983,1982,1981,1980,1979,1978,1977,1976,1975,1974,1973,1972,1971
Estas estadísticas en otros países:
AfghanistanAlbaniaAlgeriaAngolaAntigua and BarbudaArab WorldArgentinaArmeniaArubaAustraliaAustriaAzerbaijanBahamas, TheBahrainBangladeshBarbadosBelarusBelgiumBelizeBeninBhutanBoliviaBosnia and HerzegovinaBotswanaBrazilBrunei DarussalamBulgariaBurkina FasoBurundiCabo VerdeCambodiaCameroonCanadaCaribbean small statesCentral African RepublicCentral Europe and the BalticsChadChileChinaColombiaComorosCongo, Dem. Rep.Congo, Rep.Costa RicaCote d'IvoireCroatiaCuracaoCyprusCzech RepublicDenmarkDjiboutiDominicaDominican RepublicEarly-demographic dividendEast Asia & PacificEast Asia & Pacific (excluding high income)East Asia & Pacific (IDA & IBRD countries)EcuadorEgypt, Arab Rep.El SalvadorEquatorial GuineaEritreaEstoniaEthiopiaEuro areaEurope & Central AsiaEurope & Central Asia (excluding high income)Europe & Central Asia (IDA & IBRD countries)European UnionFijiFinlandFragile and conflict affected situationsFranceGabonGambia, TheGeorgiaGermanyGhanaGreeceGrenadaGuatemalaGuineaGuinea-BissauGuyanaHaitiHeavily indebted poor countries (HIPC)High incomeHondurasHong Kong SAR, ChinaHungaryIBRD onlyIcelandIDA & IBRD totalIDA blendIDA onlyIDA totalIndiaIndonesiaIran, Islamic Rep.IraqIrelandIsraelItalyJamaicaJapanJordanKazakhstanKenyaKorea, Rep.KosovoKuwaitKyrgyz RepublicLao PDRLate-demographic dividendLatin America & Caribbean Latin America & Caribbean (excluding high income)Latin America & the Caribbean (IDA & IBRD countries)LatviaLeast developed countries: UN classificationLebanonLesothoLiberiaLibyaLithuaniaLow & middle incomeLow incomeLower middle incomeLuxembourgMacao SAR, ChinaMacedonia, FYRMadagascarMalawiMalaysiaMaldivesMaliMaltaMauritaniaMauritiusMexicoMicronesia, Fed. Sts.Middle East & North AfricaMiddle East & North Africa (excluding high income)Middle East & North Africa (IDA & IBRD countries)Middle incomeMoldovaMongoliaMontenegroMoroccoMozambiqueMyanmarNamibiaNepalNetherlandsNicaraguaNigerNigeriaNorth AmericaNorwayOECD membersOmanOther small statesPacific island small statesPakistanPanamaPapua New GuineaParaguayPeruPhilippinesPolandPortugalPost-demographic dividendPre-demographic dividendQatarRomaniaRussian FederationRwandaSamoaSao Tome and PrincipeSaudi ArabiaSenegalSerbiaSeychellesSierra LeoneSingaporeSlovak RepublicSloveniaSmall statesSolomon IslandsSouth AfricaSouth AsiaSouth Asia (IDA & IBRD)South SudanSpainSri LankaSt. Kitts and NevisSt. LuciaSt. Vincent and the GrenadinesSub-Saharan Africa Sub-Saharan Africa (excluding high income)Sub-Saharan Africa (IDA & IBRD countries)SudanSurinameSwazilandSwedenSwitzerlandSyrian Arab RepublicTajikistanTanzaniaThailandTimor-LesteTogoTongaTrinidad and TobagoTunisiaTurkeyUgandaUkraineUnited KingdomUnited StatesUpper middle incomeUruguayVanuatuVenezuela, RBVietnamWest Bank and GazaWorldYemen, Rep.ZambiaZimbabwe línea de tiempo (timeline):
En esta escala de tiempo se presenta un gráfico de 1971 y 2016 de North America. Los datos de 1970 están ausentes. El número de observaciones reales por fecha: 46.
Fuente (nombre):
Indicadores del desarrollo mundial
Fuente (organización):
International Monetary Fund, International Financial Statistics and data files.
Categorías:
Financial Sector, External Debt
Se ha actualizado:
23 abr 2017 año
Los indicadores de los cambios de valor en los últimos años
Mínimo:
0.908
1 ene 2006 año
Máximo:
5.825
1 ene 1981 año
A la fecha de observación
Valor
Cambio absoluto
El cambio con respecto al valor anterior
1 ene 1971 año
2.997
+2.997
0.0%
1 ene 1972 año
2.778
-0.22
-7.33%
1 ene 1973 año
3.078
+0.3
10.82%
1 ene 1974 año
3.827
+0.749
24.34%
1 ene 1975 año
4.503
+0.676
17.66%
1 ene 1976 año
3.585
-0.917
-20.37%
1 ene 1977 año
3.026
-0.559
-15.59%
1 ene 1978 año
3.081
+0.054
1.8%
1 ene 1979 año
3.4
+0.319
10.35%
1 ene 1980 año
5.746
+2.346
69.01%
1 ene 1981 año
5.825
+0.079
1.37%
1 ene 1982 año
3.848
-1.977
-33.94%
1 ene 1983 año
4.587
+0.739
19.21%
1 ene 1984 año
3.704
-0.883
-19.26%
1 ene 1985 año
2.522
-1.181
-31.9%
1 ene 1986 año
2.783
+0.261
10.35%
1 ene 1987 año
3.015
+0.232
8.33%
1 ene 1988 año
3.1
+0.085
2.81%
1 ene 1989 año
2.481
-0.618
-19.94%
1 ene 1990 año
2.653
+0.172
6.92%
1 ene 1991 año
2.592
-0.061
-2.3%
1 ene 1992 año
2.458
-0.134
-5.16%
1 ene 1993 año
2.188
-0.27
-11.0%
1 ene 1994 año
2.273
+0.085
3.87%
1 ene 1995 año
1.962
-0.31
-13.65%
1 ene 1996 año
1.858
-0.105
-5.33%
1 ene 1997 año
1.588
-0.27
-14.52%
1 ene 1998 año
1.201
-0.387
-24.39%
1 ene 1999 año
1.252
+0.051
4.27%
1 ene 2000 año
1.088
-0.165
-13.14%
1 ene 2001 año
0.922
-0.165
-15.2%
1 ene 2002 año
1.03
+0.108
11.72%
1 ene 2003 año
1.197
+0.166
16.14%
1 ene 2004 año
1.237
+0.04
3.35%
1 ene 2005 año
1.073
-0.164
-13.24%
1 ene 2006 año
0.908
-0.165
-15.38%
1 ene 2007 año
0.912
+0.004
0.48%
1 ene 2008 año
1.048
+0.136
14.92%
1 ene 2009 año
1.066
+0.017
1.64%
1 ene 2010 año
1.901
+0.835
78.36%
1 ene 2011 año
1.962
+0.062
3.25%
1 ene 2012 año
1.917
-0.046
-2.32%
1 ene 2013 año
1.988
+0.072
3.74%
1 ene 2014 año
1.567
-0.421
-21.19%
1 ene 2015 año
1.477
-0.09
-5.74%
1 ene 2016 año
1.405
-0.072
-4.88%
Ranking de los países por los datos estadísticos actuales


Comentarios: