29
/es/
es
AIzaSyAYiBZKx7MnpbEhh9jyipgxe19OcubqV5w
April 1, 2024
32280
Europe & Central Asia (excluding high income)
ECA
false
2
1
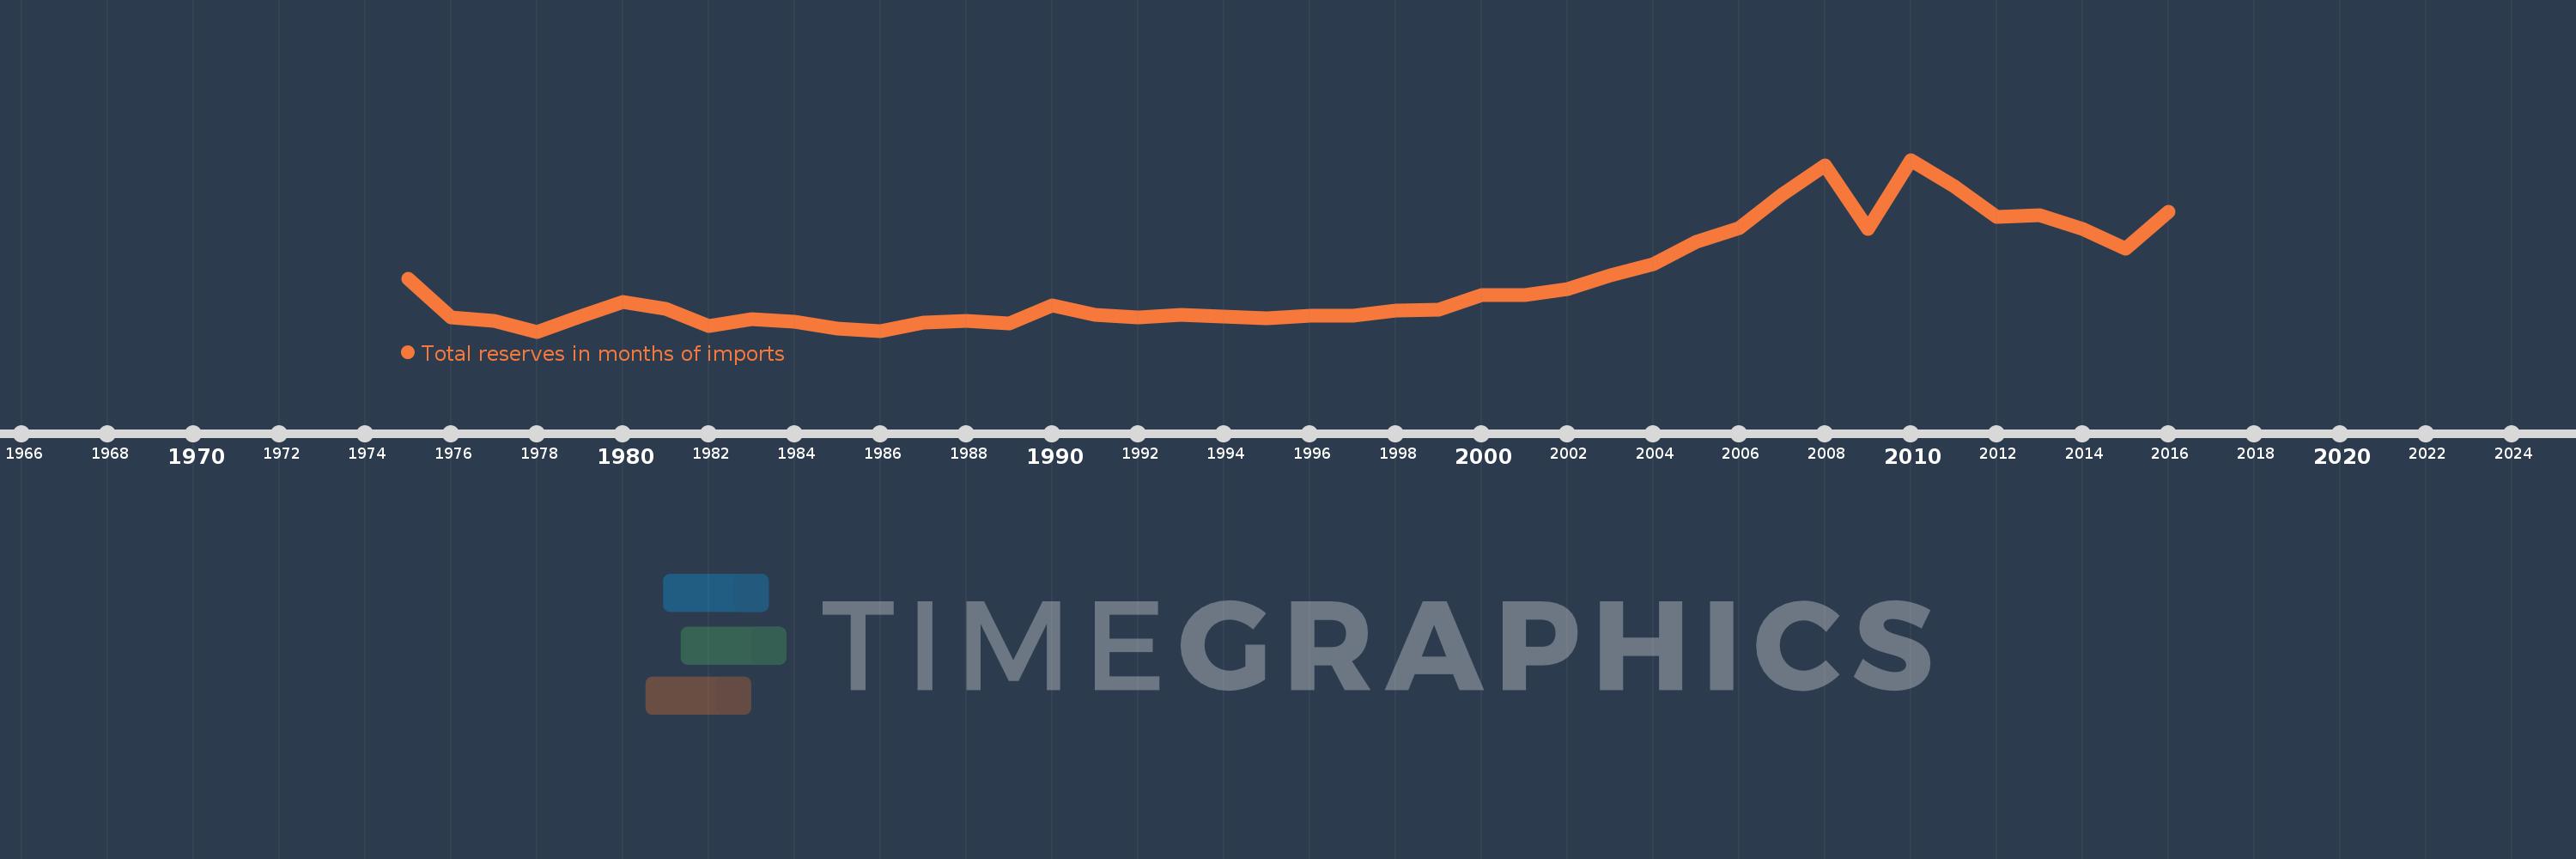
Total reserves in months of imports
2016,2015,2014,2013,2012,2011,2010,2009,2008,2007,2006,2005,2004,2003,2002,2001,2000,1999,1998,1997,1996,1995,1993,1992,1991,1990,1989,1988,1987,1986,1985,1984,1983,1982,1981,1980,1979,1978,1977,1976,1975
Estas estadísticas en otros países:
AfghanistanAlbaniaAlgeriaAngolaAntigua and BarbudaArab WorldArgentinaArmeniaArubaAustraliaAustriaAzerbaijanBahamas, TheBahrainBangladeshBarbadosBelarusBelgiumBelizeBeninBhutanBoliviaBosnia and HerzegovinaBotswanaBrazilBrunei DarussalamBulgariaBurkina FasoBurundiCabo VerdeCambodiaCameroonCanadaCaribbean small statesCentral African RepublicCentral Europe and the BalticsChadChileChinaColombiaComorosCongo, Dem. Rep.Congo, Rep.Costa RicaCote d'IvoireCroatiaCuracaoCyprusCzech RepublicDenmarkDjiboutiDominicaDominican RepublicEarly-demographic dividendEast Asia & PacificEast Asia & Pacific (excluding high income)East Asia & Pacific (IDA & IBRD countries)EcuadorEgypt, Arab Rep.El SalvadorEquatorial GuineaEritreaEstoniaEthiopiaEuro areaEurope & Central AsiaEurope & Central Asia (excluding high income)Europe & Central Asia (IDA & IBRD countries)European UnionFijiFinlandFragile and conflict affected situationsFranceGabonGambia, TheGeorgiaGermanyGhanaGreeceGrenadaGuatemalaGuineaGuinea-BissauGuyanaHaitiHeavily indebted poor countries (HIPC)High incomeHondurasHong Kong SAR, ChinaHungaryIBRD onlyIcelandIDA & IBRD totalIDA blendIDA onlyIDA totalIndiaIndonesiaIran, Islamic Rep.IraqIrelandIsraelItalyJamaicaJapanJordanKazakhstanKenyaKorea, Rep.KosovoKuwaitKyrgyz RepublicLao PDRLate-demographic dividendLatin America & Caribbean Latin America & Caribbean (excluding high income)Latin America & the Caribbean (IDA & IBRD countries)LatviaLeast developed countries: UN classificationLebanonLesothoLiberiaLibyaLithuaniaLow & middle incomeLow incomeLower middle incomeLuxembourgMacao SAR, ChinaMacedonia, FYRMadagascarMalawiMalaysiaMaldivesMaliMaltaMauritaniaMauritiusMexicoMicronesia, Fed. Sts.Middle East & North AfricaMiddle East & North Africa (excluding high income)Middle East & North Africa (IDA & IBRD countries)Middle incomeMoldovaMongoliaMontenegroMoroccoMozambiqueMyanmarNamibiaNepalNetherlandsNicaraguaNigerNigeriaNorth AmericaNorwayOECD membersOmanOther small statesPacific island small statesPakistanPanamaPapua New GuineaParaguayPeruPhilippinesPolandPortugalPost-demographic dividendPre-demographic dividendQatarRomaniaRussian FederationRwandaSamoaSao Tome and PrincipeSaudi ArabiaSenegalSerbiaSeychellesSierra LeoneSingaporeSlovak RepublicSloveniaSmall statesSolomon IslandsSouth AfricaSouth AsiaSouth Asia (IDA & IBRD)South SudanSpainSri LankaSt. Kitts and NevisSt. LuciaSt. Vincent and the GrenadinesSub-Saharan Africa Sub-Saharan Africa (excluding high income)Sub-Saharan Africa (IDA & IBRD countries)SudanSurinameSwazilandSwedenSwitzerlandSyrian Arab RepublicTajikistanTanzaniaThailandTimor-LesteTogoTongaTrinidad and TobagoTunisiaTurkeyUgandaUkraineUnited KingdomUnited StatesUpper middle incomeUruguayVanuatuVenezuela, RBVietnamWest Bank and GazaWorldYemen, Rep.ZambiaZimbabwe línea de tiempo (timeline):
En esta escala de tiempo se presenta un gráfico de 1975 y 2016 de Europe & Central Asia (excluding high income). Los datos de 1974 están ausentes. El número de observaciones reales por fecha: 41.
Fuente (nombre):
Indicadores del desarrollo mundial
Fuente (organización):
International Monetary Fund, International Financial Statistics and data files.
Categorías:
Financial Sector, External Debt
Se ha actualizado:
23 abr 2017 año
Los indicadores de los cambios de valor en los últimos años
Mínimo:
1.857
1 ene 1978 año
Máximo:
12.937
1 ene 2010 año
A la fecha de observación
Valor
Cambio absoluto
El cambio con respecto al valor anterior
1 ene 1975 año
5.278
+5.278
0.0%
1 ene 1976 año
2.788
-2.49
-47.18%
1 ene 1977 año
2.548
-0.241
-8.63%
1 ene 1978 año
1.857
-0.691
-27.11%
1 ene 1979 año
2.81
+0.953
51.32%
1 ene 1980 año
3.754
+0.944
33.61%
1 ene 1981 año
3.322
-0.432
-11.51%
1 ene 1982 año
2.234
-1.088
-32.76%
1 ene 1983 año
2.655
+0.421
18.86%
1 ene 1984 año
2.499
-0.156
-5.88%
1 ene 1985 año
2.074
-0.425
-17.02%
1 ene 1986 año
1.885
-0.189
-9.11%
1 ene 1987 año
2.444
+0.559
29.64%
1 ene 1988 año
2.533
+0.089
3.65%
1 ene 1989 año
2.388
-0.145
-5.71%
1 ene 1990 año
3.57
+1.182
49.48%
1 ene 1991 año
2.932
-0.638
-17.86%
1 ene 1992 año
2.781
-0.152
-5.18%
1 ene 1993 año
2.931
+0.15
5.4%
1 ene 1995 año
2.707
-0.224
-7.65%
1 ene 1996 año
2.865
+0.158
5.85%
1 ene 1997 año
2.891
+0.026
0.91%
1 ene 1998 año
3.198
+0.307
10.62%
1 ene 1999 año
3.256
+0.058
1.81%
1 ene 2000 año
4.215
+0.96
29.48%
1 ene 2001 año
4.203
-0.013
-0.3%
1 ene 2002 año
4.613
+0.41
9.76%
1 ene 2003 año
5.484
+0.871
18.89%
1 ene 2004 año
6.218
+0.734
13.38%
1 ene 2005 año
7.619
+1.4
22.52%
1 ene 2006 año
8.55
+0.931
12.22%
1 ene 2007 año
10.709
+2.159
25.25%
1 ene 2008 año
12.572
+1.863
17.4%
1 ene 2009 año
8.502
-4.07
-32.37%
1 ene 2010 año
12.937
+4.435
52.16%
1 ene 2011 año
11.273
-1.664
-12.86%
1 ene 2012 año
9.247
-2.026
-17.97%
1 ene 2013 año
9.338
+0.09
0.98%
1 ene 2014 año
8.501
-0.836
-8.96%
1 ene 2015 año
7.19
-1.311
-15.42%
1 ene 2016 año
9.579
+2.389
33.22%
Ranking de los países por los datos estadísticos actuales


Comentarios: