29
/es/
es
AIzaSyAYiBZKx7MnpbEhh9jyipgxe19OcubqV5w
April 1, 2024
26974
Early-demographic dividend
EAR
false
2
1
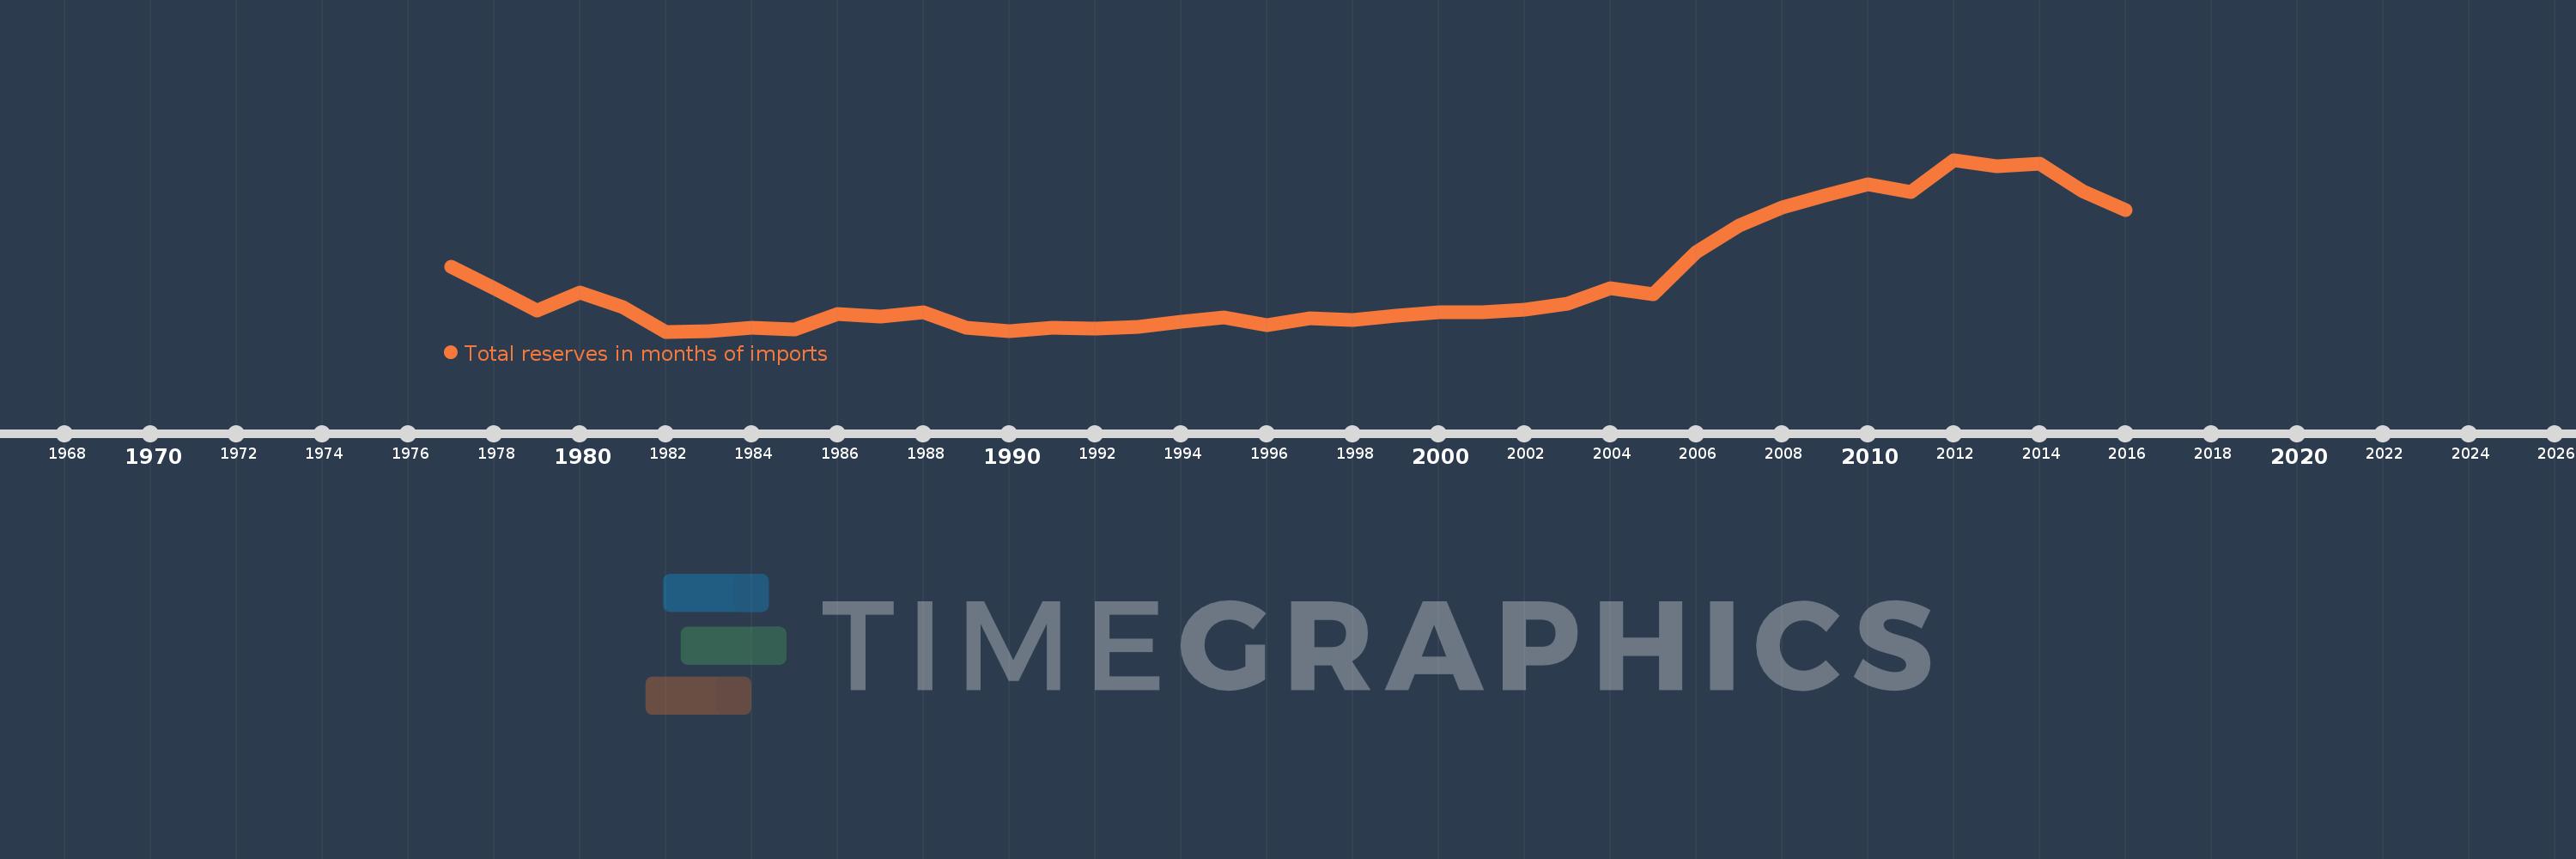
Total reserves in months of imports
2016,2015,2014,2013,2012,2011,2010,2009,2008,2007,2006,2005,2004,2003,2002,2001,2000,1999,1998,1997,1996,1995,1994,1993,1992,1991,1990,1989,1988,1987,1986,1985,1984,1983,1982,1981,1980,1979,1978,1977
Estas estadísticas en otros países:
AfghanistanAlbaniaAlgeriaAngolaAntigua and BarbudaArab WorldArgentinaArmeniaArubaAustraliaAustriaAzerbaijanBahamas, TheBahrainBangladeshBarbadosBelarusBelgiumBelizeBeninBhutanBoliviaBosnia and HerzegovinaBotswanaBrazilBrunei DarussalamBulgariaBurkina FasoBurundiCabo VerdeCambodiaCameroonCanadaCaribbean small statesCentral African RepublicCentral Europe and the BalticsChadChileChinaColombiaComorosCongo, Dem. Rep.Congo, Rep.Costa RicaCote d'IvoireCroatiaCuracaoCyprusCzech RepublicDenmarkDjiboutiDominicaDominican RepublicEarly-demographic dividendEast Asia & PacificEast Asia & Pacific (excluding high income)East Asia & Pacific (IDA & IBRD countries)EcuadorEgypt, Arab Rep.El SalvadorEquatorial GuineaEritreaEstoniaEthiopiaEuro areaEurope & Central AsiaEurope & Central Asia (excluding high income)Europe & Central Asia (IDA & IBRD countries)European UnionFijiFinlandFragile and conflict affected situationsFranceGabonGambia, TheGeorgiaGermanyGhanaGreeceGrenadaGuatemalaGuineaGuinea-BissauGuyanaHaitiHeavily indebted poor countries (HIPC)High incomeHondurasHong Kong SAR, ChinaHungaryIBRD onlyIcelandIDA & IBRD totalIDA blendIDA onlyIDA totalIndiaIndonesiaIran, Islamic Rep.IraqIrelandIsraelItalyJamaicaJapanJordanKazakhstanKenyaKorea, Rep.KosovoKuwaitKyrgyz RepublicLao PDRLate-demographic dividendLatin America & Caribbean Latin America & Caribbean (excluding high income)Latin America & the Caribbean (IDA & IBRD countries)LatviaLeast developed countries: UN classificationLebanonLesothoLiberiaLibyaLithuaniaLow & middle incomeLow incomeLower middle incomeLuxembourgMacao SAR, ChinaMacedonia, FYRMadagascarMalawiMalaysiaMaldivesMaliMaltaMauritaniaMauritiusMexicoMicronesia, Fed. Sts.Middle East & North AfricaMiddle East & North Africa (excluding high income)Middle East & North Africa (IDA & IBRD countries)Middle incomeMoldovaMongoliaMontenegroMoroccoMozambiqueMyanmarNamibiaNepalNetherlandsNicaraguaNigerNigeriaNorth AmericaNorwayOECD membersOmanOther small statesPacific island small statesPakistanPanamaPapua New GuineaParaguayPeruPhilippinesPolandPortugalPost-demographic dividendPre-demographic dividendQatarRomaniaRussian FederationRwandaSamoaSao Tome and PrincipeSaudi ArabiaSenegalSerbiaSeychellesSierra LeoneSingaporeSlovak RepublicSloveniaSmall statesSolomon IslandsSouth AfricaSouth AsiaSouth Asia (IDA & IBRD)South SudanSpainSri LankaSt. Kitts and NevisSt. LuciaSt. Vincent and the GrenadinesSub-Saharan Africa Sub-Saharan Africa (excluding high income)Sub-Saharan Africa (IDA & IBRD countries)SudanSurinameSwazilandSwedenSwitzerlandSyrian Arab RepublicTajikistanTanzaniaThailandTimor-LesteTogoTongaTrinidad and TobagoTunisiaTurkeyUgandaUkraineUnited KingdomUnited StatesUpper middle incomeUruguayVanuatuVenezuela, RBVietnamWest Bank and GazaWorldYemen, Rep.ZambiaZimbabwe línea de tiempo (timeline):
En esta escala de tiempo se presenta un gráfico de 1977 y 2016 de Early-demographic dividend. Los datos de 1976 están ausentes. El número de observaciones reales por fecha: 40.
Fuente (nombre):
Indicadores del desarrollo mundial
Fuente (organización):
International Monetary Fund, International Financial Statistics and data files.
Categorías:
Financial Sector, External Debt
Se ha actualizado:
23 abr 2017 año
Los indicadores de los cambios de valor en los últimos años
Mínimo:
4.593
1 ene 1982 año
Máximo:
20.314
1 ene 2012 año
A la fecha de observación
Valor
Cambio absoluto
El cambio con respecto al valor anterior
1 ene 1977 año
10.539
+10.539
0.0%
1 ene 1978 año
8.555
-1.984
-18.82%
1 ene 1979 año
6.505
-2.05
-23.97%
1 ene 1980 año
8.19
+1.686
25.92%
1 ene 1981 año
6.802
-1.388
-16.95%
1 ene 1982 año
4.593
-2.209
-32.47%
1 ene 1983 año
4.639
+0.045
0.99%
1 ene 1984 año
4.948
+0.309
6.67%
1 ene 1985 año
4.794
-0.154
-3.11%
1 ene 1986 año
6.225
+1.431
29.84%
1 ene 1987 año
5.992
-0.233
-3.74%
1 ene 1988 año
6.362
+0.369
6.16%
1 ene 1989 año
4.941
-1.421
-22.34%
1 ene 1990 año
4.629
-0.311
-6.3%
1 ene 1991 año
4.962
+0.333
7.19%
1 ene 1992 año
4.885
-0.077
-1.56%
1 ene 1993 año
5.022
+0.137
2.81%
1 ene 1994 año
5.474
+0.452
9.01%
1 ene 1995 año
5.928
+0.453
8.28%
1 ene 1996 año
5.168
-0.76
-12.81%
1 ene 1997 año
5.838
+0.67
12.96%
1 ene 1998 año
5.64
-0.198
-3.4%
1 ene 1999 año
6.024
+0.384
6.81%
1 ene 2000 año
6.343
+0.319
5.29%
1 ene 2001 año
6.336
-0.006
-0.1%
1 ene 2002 año
6.634
+0.298
4.7%
1 ene 2003 año
7.143
+0.509
7.67%
1 ene 2004 año
8.571
+1.428
19.99%
1 ene 2005 año
8.021
-0.55
-6.42%
1 ene 2006 año
11.829
+3.808
47.48%
1 ene 2007 año
14.274
+2.445
20.67%
1 ene 2008 año
15.93
+1.655
11.6%
1 ene 2009 año
17.063
+1.134
7.12%
1 ene 2010 año
18.06
+0.996
5.84%
1 ene 2011 año
17.396
-0.664
-3.68%
1 ene 2012 año
20.314
+2.918
16.77%
1 ene 2013 año
19.75
-0.563
-2.77%
1 ene 2014 año
19.989
+0.238
1.21%
1 ene 2015 año
17.468
-2.521
-12.61%
1 ene 2016 año
15.715
-1.753
-10.04%
Ranking de los países por los datos estadísticos actuales


Comentarios: