29
/es/
es
AIzaSyAYiBZKx7MnpbEhh9jyipgxe19OcubqV5w
April 1, 2024
149831
Haiti
HTI
true
2
1
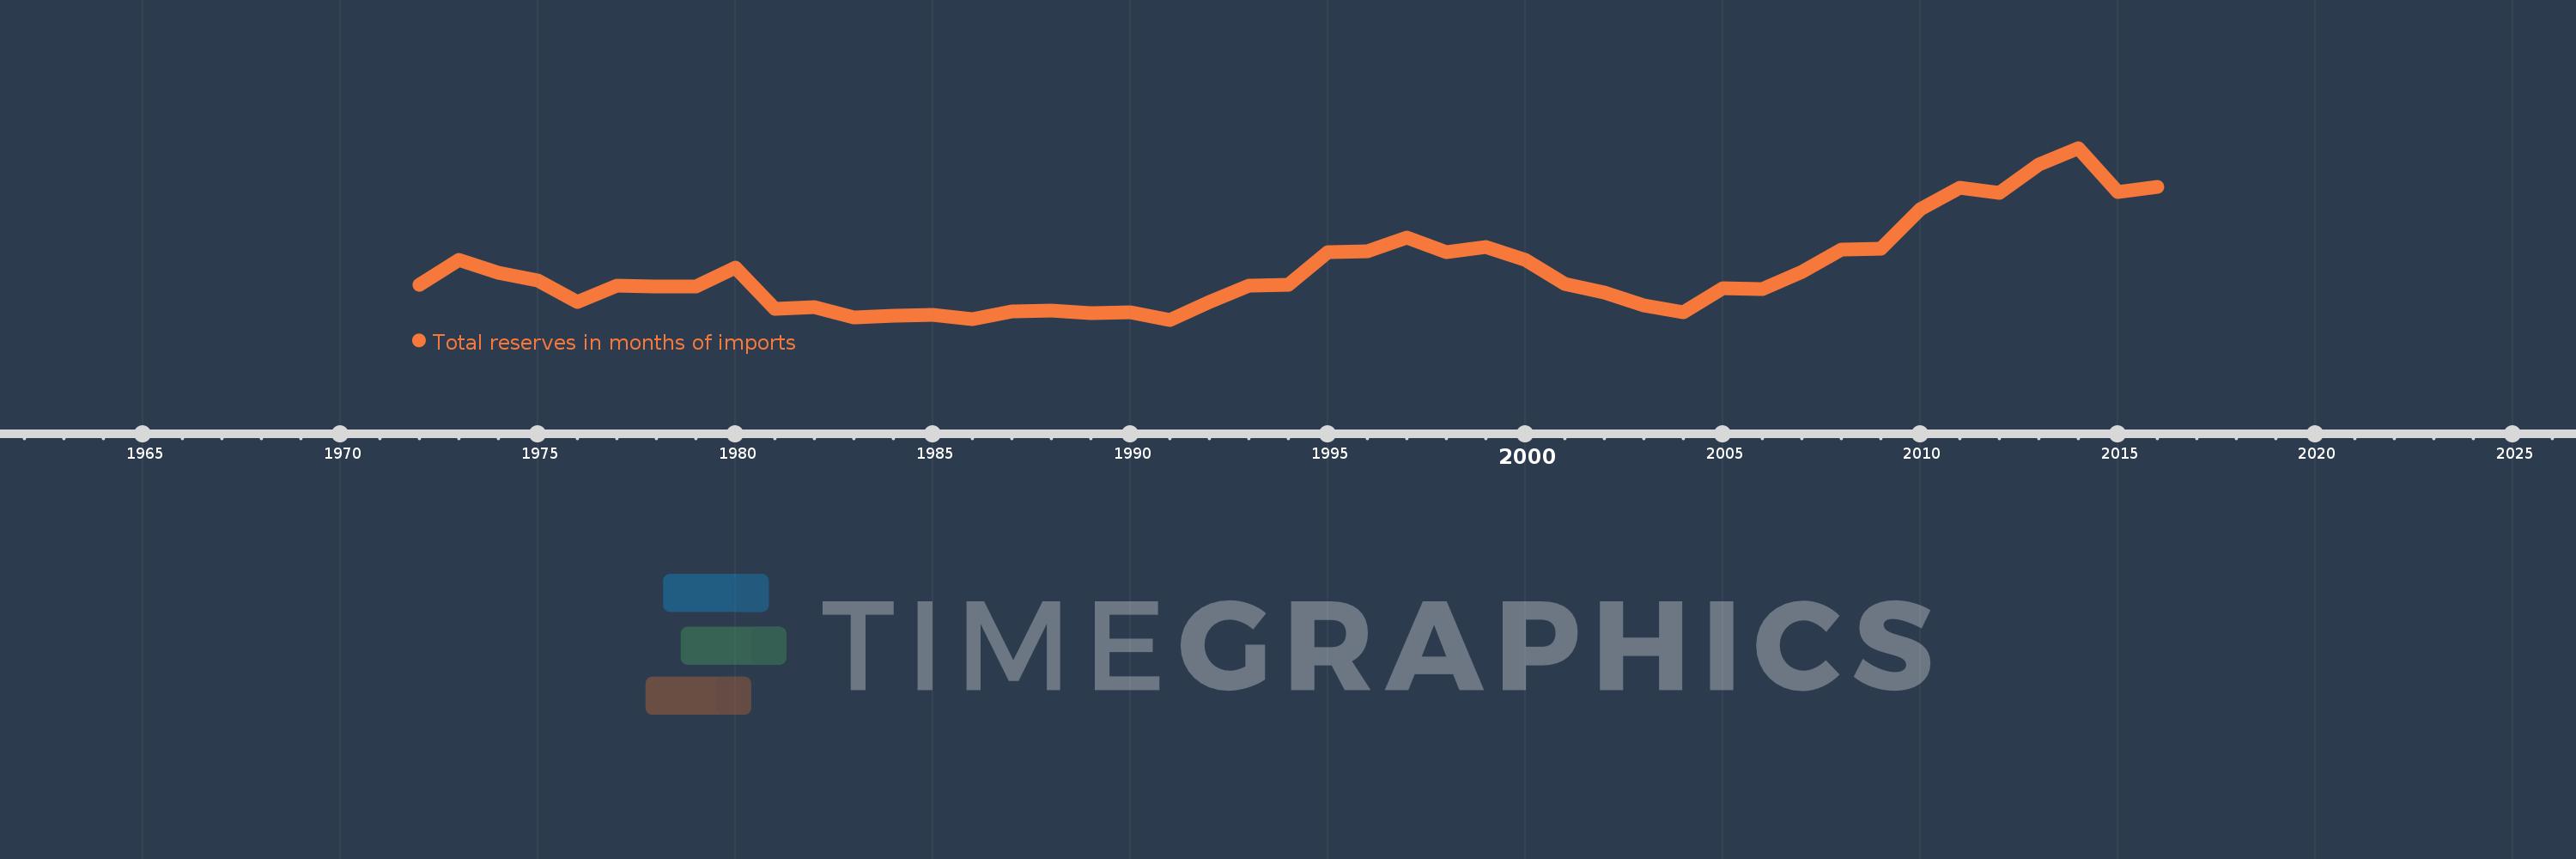
Total reserves in months of imports
2016,2015,2014,2013,2012,2011,2010,2009,2008,2007,2006,2005,2004,2003,2002,2001,2000,1999,1998,1997,1996,1995,1994,1993,1992,1991,1990,1989,1988,1987,1986,1985,1984,1983,1982,1981,1980,1979,1978,1977,1976,1975,1974,1973,1972
Estas estadísticas en otros países:
AfghanistanAlbaniaAlgeriaAngolaAntigua and BarbudaArab WorldArgentinaArmeniaArubaAustraliaAustriaAzerbaijanBahamas, TheBahrainBangladeshBarbadosBelarusBelgiumBelizeBeninBhutanBoliviaBosnia and HerzegovinaBotswanaBrazilBrunei DarussalamBulgariaBurkina FasoBurundiCabo VerdeCambodiaCameroonCanadaCaribbean small statesCentral African RepublicCentral Europe and the BalticsChadChileChinaColombiaComorosCongo, Dem. Rep.Congo, Rep.Costa RicaCote d'IvoireCroatiaCuracaoCyprusCzech RepublicDenmarkDjiboutiDominicaDominican RepublicEarly-demographic dividendEast Asia & PacificEast Asia & Pacific (excluding high income)East Asia & Pacific (IDA & IBRD countries)EcuadorEgypt, Arab Rep.El SalvadorEquatorial GuineaEritreaEstoniaEthiopiaEuro areaEurope & Central AsiaEurope & Central Asia (excluding high income)Europe & Central Asia (IDA & IBRD countries)European UnionFijiFinlandFragile and conflict affected situationsFranceGabonGambia, TheGeorgiaGermanyGhanaGreeceGrenadaGuatemalaGuineaGuinea-BissauGuyanaHaitiHeavily indebted poor countries (HIPC)High incomeHondurasHong Kong SAR, ChinaHungaryIBRD onlyIcelandIDA & IBRD totalIDA blendIDA onlyIDA totalIndiaIndonesiaIran, Islamic Rep.IraqIrelandIsraelItalyJamaicaJapanJordanKazakhstanKenyaKorea, Rep.KosovoKuwaitKyrgyz RepublicLao PDRLate-demographic dividendLatin America & Caribbean Latin America & Caribbean (excluding high income)Latin America & the Caribbean (IDA & IBRD countries)LatviaLeast developed countries: UN classificationLebanonLesothoLiberiaLibyaLithuaniaLow & middle incomeLow incomeLower middle incomeLuxembourgMacao SAR, ChinaMacedonia, FYRMadagascarMalawiMalaysiaMaldivesMaliMaltaMauritaniaMauritiusMexicoMicronesia, Fed. Sts.Middle East & North AfricaMiddle East & North Africa (excluding high income)Middle East & North Africa (IDA & IBRD countries)Middle incomeMoldovaMongoliaMontenegroMoroccoMozambiqueMyanmarNamibiaNepalNetherlandsNicaraguaNigerNigeriaNorth AmericaNorwayOECD membersOmanOther small statesPacific island small statesPakistanPanamaPapua New GuineaParaguayPeruPhilippinesPolandPortugalPost-demographic dividendPre-demographic dividendQatarRomaniaRussian FederationRwandaSamoaSao Tome and PrincipeSaudi ArabiaSenegalSerbiaSeychellesSierra LeoneSingaporeSlovak RepublicSloveniaSmall statesSolomon IslandsSouth AfricaSouth AsiaSouth Asia (IDA & IBRD)South SudanSpainSri LankaSt. Kitts and NevisSt. LuciaSt. Vincent and the GrenadinesSub-Saharan Africa Sub-Saharan Africa (excluding high income)Sub-Saharan Africa (IDA & IBRD countries)SudanSurinameSwazilandSwedenSwitzerlandSyrian Arab RepublicTajikistanTanzaniaThailandTimor-LesteTogoTongaTrinidad and TobagoTunisiaTurkeyUgandaUkraineUnited KingdomUnited StatesUpper middle incomeUruguayVanuatuVenezuela, RBVietnamWest Bank and GazaWorldYemen, Rep.ZambiaZimbabwe línea de tiempo (timeline):
En esta escala de tiempo se presenta un gráfico de 1972 y 2016 de Haiti. Los datos de 1971 están ausentes. El número de observaciones reales por fecha: 45.
Fuente (nombre):
Indicadores del desarrollo mundial
Fuente (organización):
International Monetary Fund, International Financial Statistics and data files.
Categorías:
Financial Sector, External Debt
Se ha actualizado:
23 abr 2017 año
Los indicadores de los cambios de valor en los últimos años
Mínimo:
0.226
1 ene 1991 año
Máximo:
6.817
1 ene 2014 año
A la fecha de observación
Valor
Cambio absoluto
El cambio con respecto al valor anterior
1 ene 1972 año
1.579
+1.579
0.0%
1 ene 1973 año
2.517
+0.938
59.43%
1 ene 1974 año
2.032
-0.485
-19.26%
1 ene 1975 año
1.729
-0.304
-14.94%
1 ene 1976 año
0.909
-0.819
-47.39%
1 ene 1977 año
1.538
+0.629
69.14%
1 ene 1978 año
1.51
-0.029
-1.87%
1 ene 1979 año
1.504
-0.006
-0.37%
1 ene 1980 año
2.237
+0.733
48.77%
1 ene 1981 año
0.643
-1.594
-71.24%
1 ene 1982 año
0.7
+0.056
8.74%
1 ene 1983 año
0.304
-0.396
-56.62%
1 ene 1984 año
0.366
+0.063
20.73%
1 ene 1985 año
0.403
+0.037
10.05%
1 ene 1986 año
0.252
-0.152
-37.57%
1 ene 1987 año
0.556
+0.304
120.63%
1 ene 1988 año
0.582
+0.027
4.86%
1 ene 1989 año
0.475
-0.108
-18.46%
1 ene 1990 año
0.497
+0.023
4.74%
1 ene 1991 año
0.226
-0.271
-54.55%
1 ene 1992 año
0.902
+0.676
299.11%
1 ene 1993 año
1.531
+0.629
69.66%
1 ene 1994 año
1.555
+0.024
1.59%
1 ene 1995 año
2.831
+1.276
82.04%
1 ene 1996 año
2.866
+0.035
1.23%
1 ene 1997 año
3.381
+0.515
17.97%
1 ene 1998 año
2.822
-0.559
-16.52%
1 ene 1999 año
3.012
+0.19
6.72%
1 ene 2000 año
2.509
-0.503
-16.7%
1 ene 2001 año
1.589
-0.919
-36.65%
1 ene 2002 año
1.284
-0.306
-19.23%
1 ene 2003 año
0.78
-0.504
-39.22%
1 ene 2004 año
0.525
-0.256
-32.76%
1 ene 2005 año
1.442
+0.917
174.74%
1 ene 2006 año
1.392
-0.049
-3.41%
1 ene 2007 año
2.047
+0.655
47.05%
1 ene 2008 año
2.905
+0.858
41.89%
1 ene 2009 año
2.943
+0.038
1.3%
1 ene 2010 año
4.478
+1.535
52.18%
1 ene 2011 año
5.286
+0.808
18.03%
1 ene 2012 año
5.091
-0.195
-3.69%
1 ene 2013 año
6.189
+1.098
21.57%
1 ene 2014 año
6.817
+0.628
10.15%
1 ene 2015 año
5.112
-1.705
-25.01%
1 ene 2016 año
5.335
+0.223
4.36%
Ranking de los países por los datos estadísticos actuales


Comentarios: