29
/es/
es
AIzaSyAYiBZKx7MnpbEhh9jyipgxe19OcubqV5w
April 1, 2024
51832
North America
NAC
false
2
1
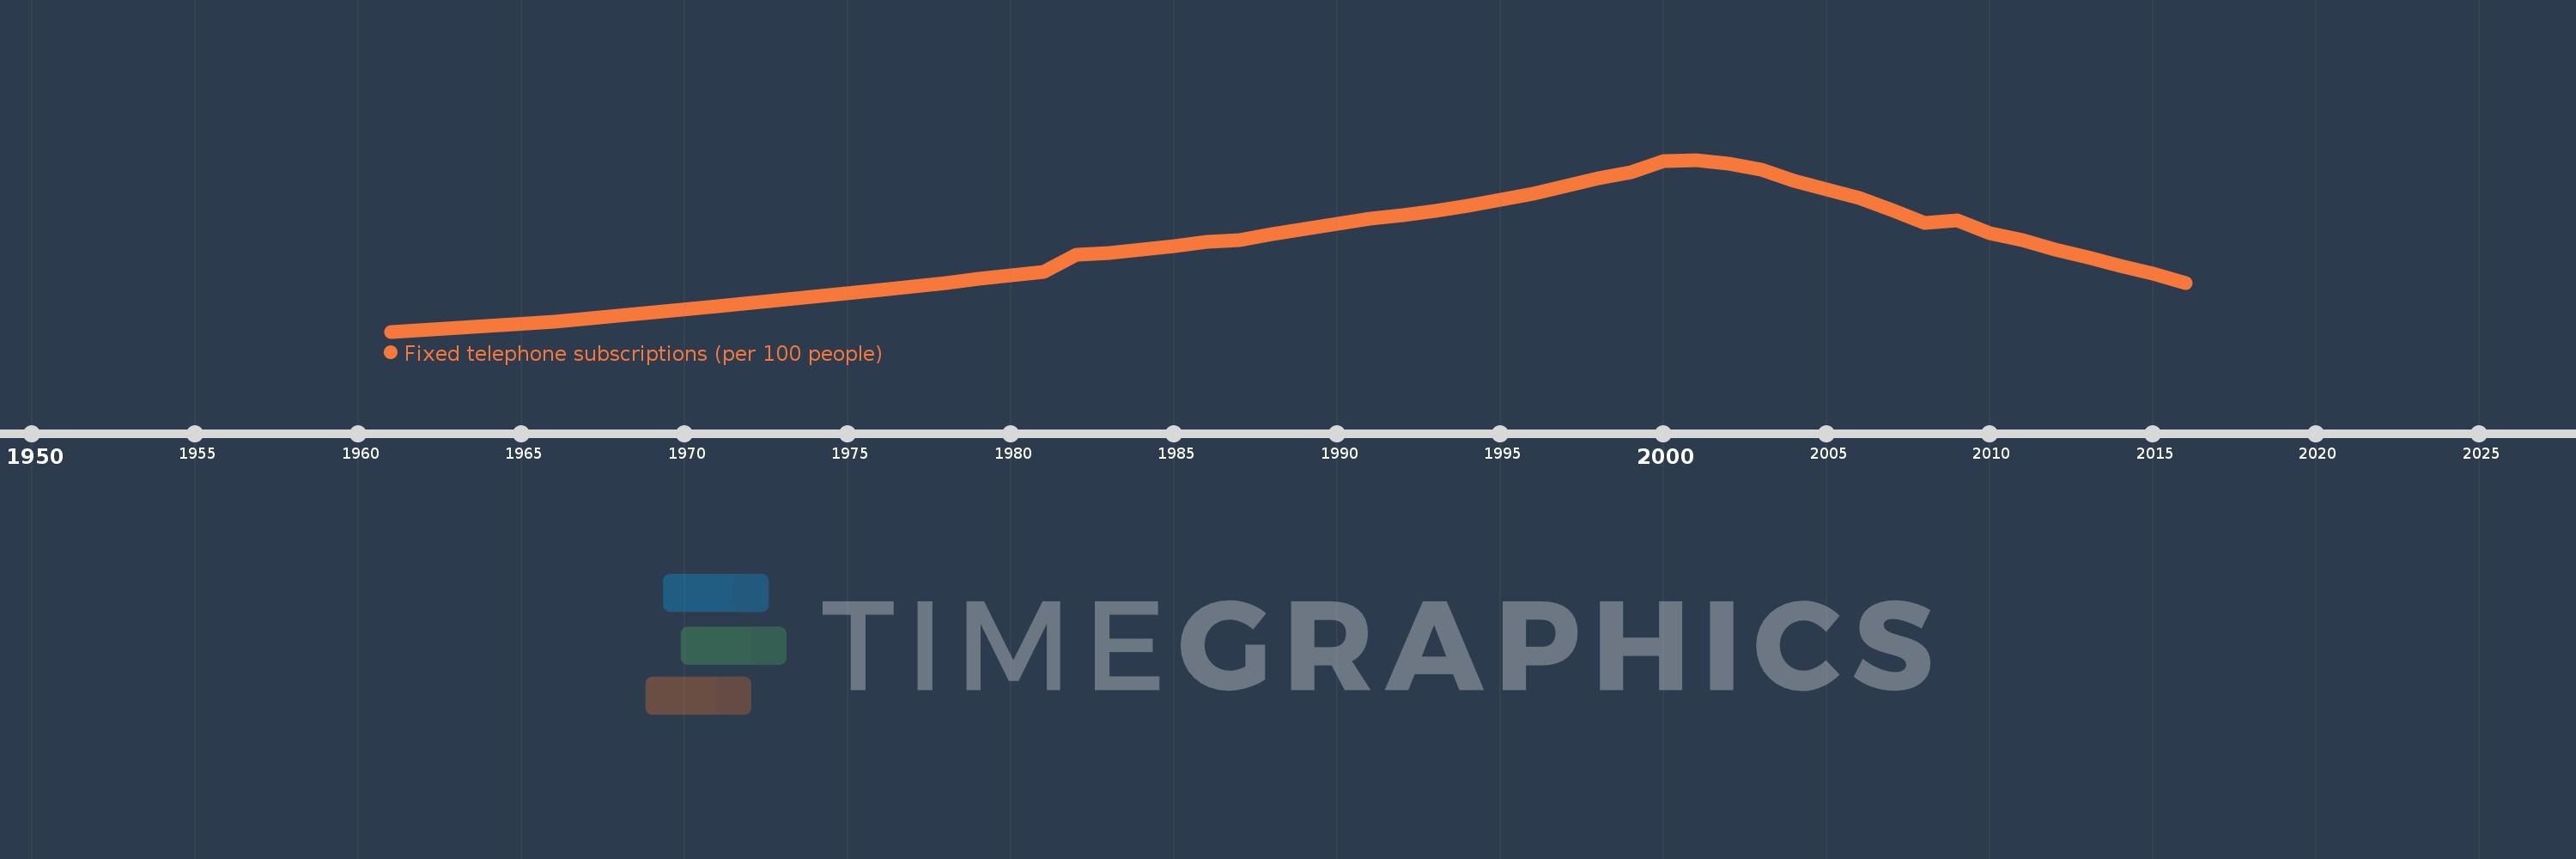
Fixed telephone subscriptions (per 100 people)
2016,2015,2014,2013,2012,2011,2010,2009,2008,2007,2006,2005,2004,2003,2002,2001,2000,1999,1998,1997,1996,1995,1994,1993,1992,1991,1990,1989,1988,1987,1986,1985,1984,1983,1982,1981,1980,1979,1978,1977,1976,1971,1966,1961
Estas estadísticas en otros países:
AfghanistanAlbaniaAlgeriaAmerican SamoaAndorraAngolaAntigua and BarbudaArab WorldArgentinaArmeniaArubaAustraliaAustriaAzerbaijanBahamas, TheBahrainBangladeshBarbadosBelarusBelgiumBelizeBeninBermudaBhutanBoliviaBosnia and HerzegovinaBotswanaBrazilBritish Virgin IslandsBrunei DarussalamBulgariaBurkina FasoBurundiCabo VerdeCambodiaCameroonCanadaCaribbean small statesCayman IslandsCentral African RepublicCentral Europe and the BalticsChadChileChinaColombiaComorosCongo, Dem. Rep.Congo, Rep.Costa RicaCote d'IvoireCroatiaCubaCuracaoCyprusCzech RepublicDenmarkDjiboutiDominicaDominican RepublicEarly-demographic dividendEast Asia & PacificEast Asia & Pacific (excluding high income)East Asia & Pacific (IDA & IBRD countries)EcuadorEgypt, Arab Rep.El SalvadorEquatorial GuineaEritreaEstoniaEthiopiaEuro areaEurope & Central AsiaEurope & Central Asia (excluding high income)Europe & Central Asia (IDA & IBRD countries)European UnionFaroe IslandsFijiFinlandFragile and conflict affected situationsFranceFrench PolynesiaGabonGambia, TheGeorgiaGermanyGhanaGibraltarGreeceGreenlandGrenadaGuamGuatemalaGuineaGuinea-BissauGuyanaHaitiHeavily indebted poor countries (HIPC)High incomeHondurasHong Kong SAR, ChinaHungaryIBRD onlyIcelandIDA & IBRD totalIDA blendIDA onlyIDA totalIndiaIndonesiaIran, Islamic Rep.IraqIrelandIsraelItalyJamaicaJapanJordanKazakhstanKenyaKiribatiKorea, Dem. People’s Rep.Korea, Rep.KosovoKuwaitKyrgyz RepublicLao PDRLate-demographic dividendLatin America & Caribbean Latin America & Caribbean (excluding high income)Latin America & the Caribbean (IDA & IBRD countries)LatviaLeast developed countries: UN classificationLebanonLesothoLiberiaLibyaLiechtensteinLithuaniaLow & middle incomeLow incomeLower middle incomeLuxembourgMacao SAR, ChinaMacedonia, FYRMadagascarMalawiMalaysiaMaldivesMaliMaltaMarshall IslandsMauritaniaMauritiusMexicoMicronesia, Fed. Sts.Middle East & North AfricaMiddle East & North Africa (excluding high income)Middle East & North Africa (IDA & IBRD countries)Middle incomeMoldovaMonacoMongoliaMontenegroMoroccoMozambiqueMyanmarNamibiaNauruNepalNetherlandsNew CaledoniaNew ZealandNicaraguaNigerNigeriaNorth AmericaNorthern Mariana IslandsNorwayOECD membersOmanOther small statesPacific island small statesPakistanPalauPanamaPapua New GuineaParaguayPeruPhilippinesPolandPortugalPost-demographic dividendPre-demographic dividendPuerto RicoQatarRomaniaRussian FederationRwandaSamoaSan MarinoSao Tome and PrincipeSaudi ArabiaSenegalSerbiaSeychellesSierra LeoneSingaporeSlovak RepublicSloveniaSmall statesSolomon IslandsSomaliaSouth AfricaSouth AsiaSouth Asia (IDA & IBRD)South SudanSpainSri LankaSt. Kitts and NevisSt. LuciaSt. Vincent and the GrenadinesSub-Saharan Africa Sub-Saharan Africa (excluding high income)Sub-Saharan Africa (IDA & IBRD countries)SudanSurinameSwazilandSwedenSwitzerlandSyrian Arab RepublicTajikistanTanzaniaThailandTimor-LesteTogoTongaTrinidad and TobagoTunisiaTurkeyTurkmenistanTurks and Caicos IslandsTuvaluUgandaUkraineUnited Arab EmiratesUnited KingdomUnited StatesUpper middle incomeUruguayUzbekistanVanuatuVenezuela, RBVietnamVirgin Islands (U.S.)West Bank and GazaWorldYemen, Rep.ZambiaZimbabwe línea de tiempo (timeline):
En esta escala de tiempo se presenta un gráfico de 1961 y 2016 de North America. Los datos de 1960 están ausentes. El número de observaciones reales por fecha: 44.
Fuente (nombre):
Indicadores del desarrollo mundial
Fuente (organización):
International Telecommunication Union, World Telecommunication/ICT Development Report and database.
Categorías:
Infrastructure
Se ha actualizado:
23 abr 2017 año
Los indicadores de los cambios de valor en los últimos años
Mínimo:
26.56
1 ene 1961 año
Máximo:
67.673
1 ene 2001 año
A la fecha de observación
Valor
Cambio absoluto
El cambio con respecto al valor anterior
1 ene 1961 año
26.56
+26.56
0.0%
1 ene 1966 año
28.972
+2.412
9.08%
1 ene 1971 año
32.66
+3.689
12.73%
1 ene 1976 año
36.603
+3.943
12.07%
1 ene 1977 año
37.325
+0.722
1.97%
1 ene 1978 año
38.15
+0.825
2.21%
1 ene 1979 año
39.123
+0.973
2.55%
1 ene 1980 año
39.993
+0.87
2.22%
1 ene 1981 año
40.937
+0.944
2.36%
1 ene 1982 año
45.043
+4.106
10.03%
1 ene 1983 año
45.372
+0.329
0.73%
1 ene 1984 año
46.153
+0.782
1.72%
1 ene 1985 año
46.936
+0.783
1.7%
1 ene 1986 año
47.987
+1.051
2.24%
1 ene 1987 año
48.517
+0.529
1.1%
1 ene 1988 año
49.836
+1.32
2.72%
1 ene 1989 año
51.058
+1.222
2.45%
1 ene 1990 año
52.344
+1.286
2.52%
1 ene 1991 año
53.662
+1.318
2.52%
1 ene 1992 año
54.452
+0.79
1.47%
1 ene 1993 año
55.414
+0.963
1.77%
1 ene 1994 año
56.649
+1.235
2.23%
1 ene 1995 año
58.052
+1.402
2.48%
1 ene 1996 año
59.608
+1.557
2.68%
1 ene 1997 año
61.31
+1.702
2.85%
1 ene 1998 año
63.237
+1.927
3.14%
1 ene 1999 año
64.621
+1.384
2.19%
1 ene 2000 año
67.31
+2.689
4.16%
1 ene 2001 año
67.673
+0.363
0.54%
1 ene 2002 año
66.781
-0.892
-1.32%
1 ene 2003 año
65.273
-1.508
-2.26%
1 ene 2004 año
62.735
-2.538
-3.89%
1 ene 2005 año
60.558
-2.177
-3.47%
1 ene 2006 año
58.509
-2.05
-3.38%
1 ene 2007 año
55.678
-2.83
-4.84%
1 ene 2008 año
52.476
-3.203
-5.75%
1 ene 2009 año
53.242
+0.766
1.46%
1 ene 2010 año
49.995
-3.246
-6.1%
1 ene 2011 año
48.523
-1.472
-2.94%
1 ene 2012 año
46.249
-2.275
-4.69%
1 ene 2013 año
44.377
-1.871
-4.05%
1 ene 2014 año
42.282
-2.096
-4.72%
1 ene 2015 año
40.463
-1.819
-4.3%
1 ene 2016 año
38.194
-2.269
-5.61%
Ranking de los países por los datos estadísticos actuales


Comentarios: