29
/es/
es
AIzaSyAYiBZKx7MnpbEhh9jyipgxe19OcubqV5w
April 1, 2024
142528
Greenland
GRL
true
2
1
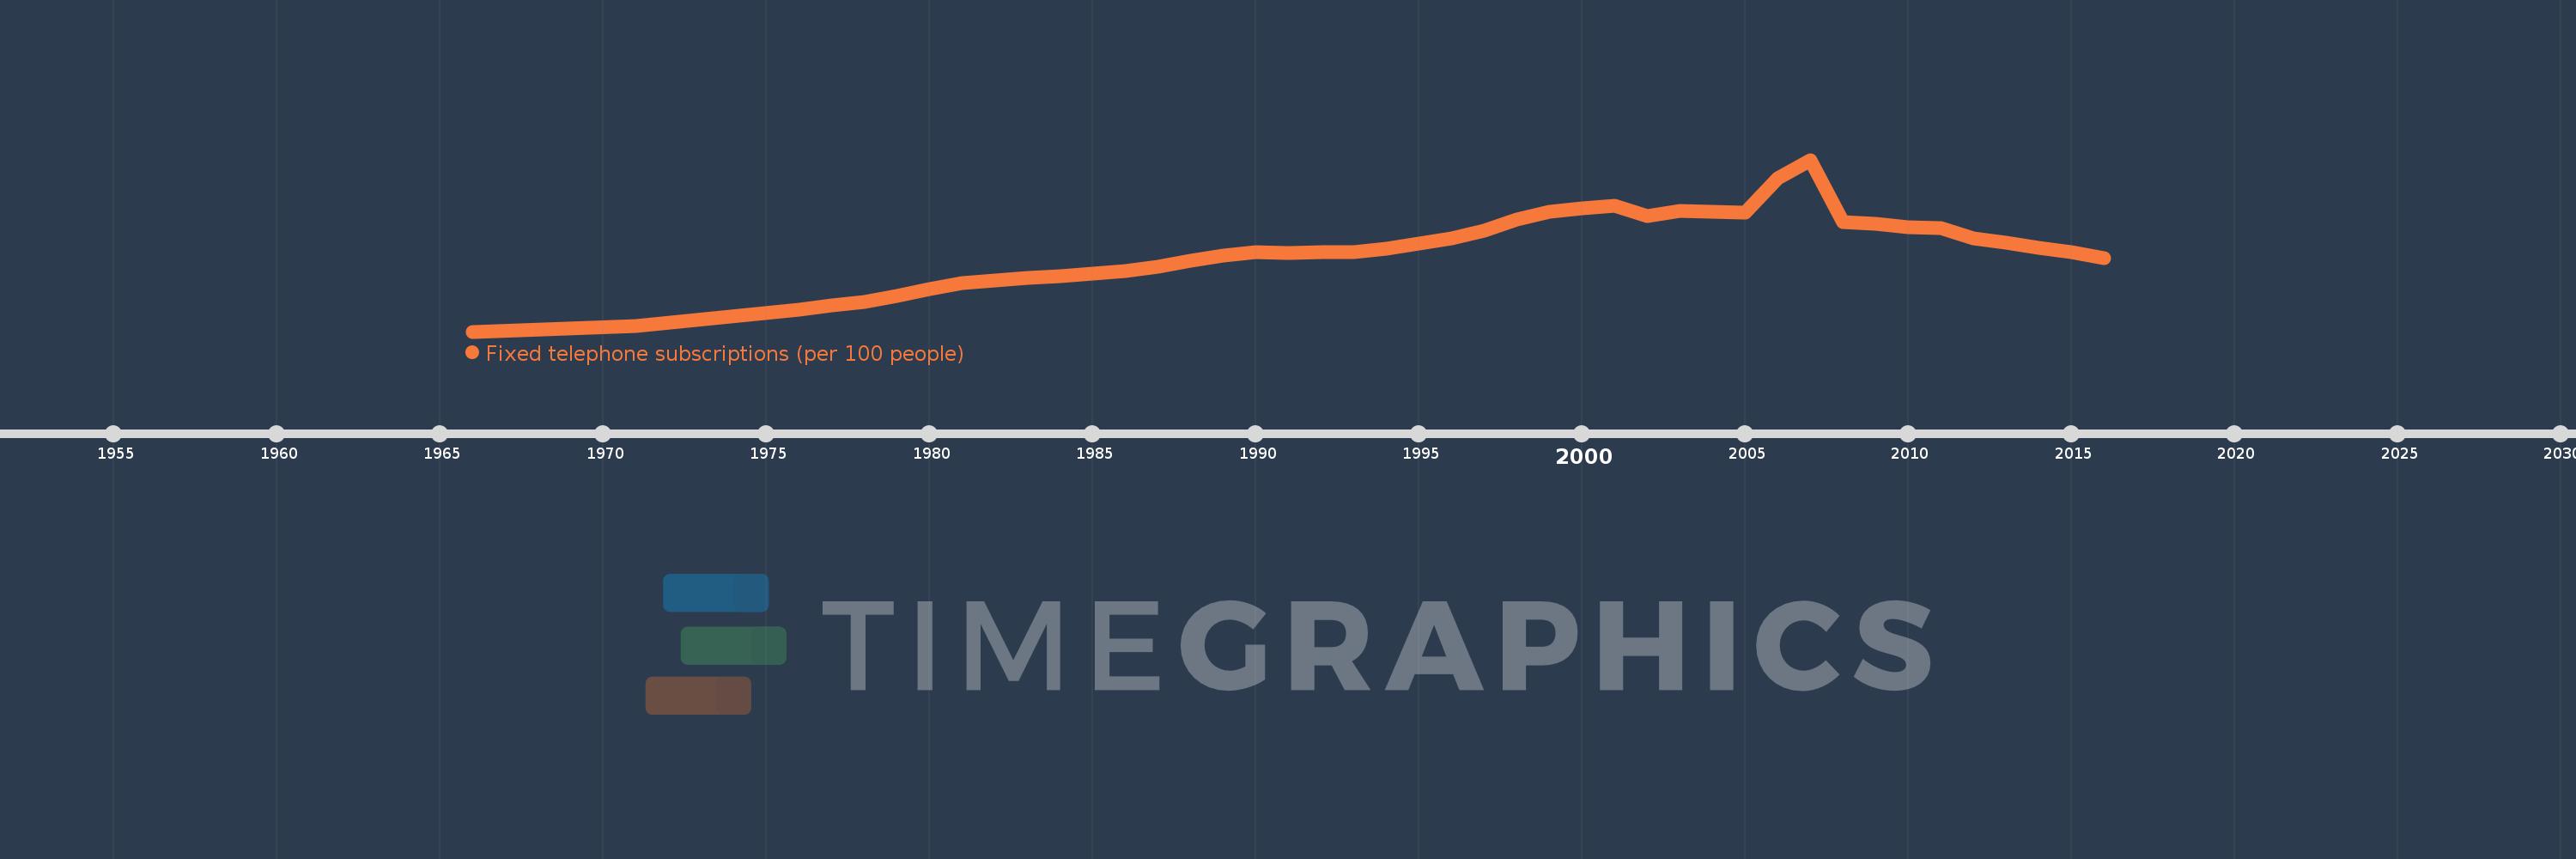
Fixed telephone subscriptions (per 100 people)
2016,2015,2014,2013,2012,2011,2010,2009,2008,2007,2006,2005,2004,2003,2002,2001,2000,1999,1998,1997,1996,1995,1994,1993,1992,1991,1990,1989,1988,1987,1986,1985,1984,1983,1982,1981,1980,1979,1978,1977,1976,1971,1966
Estas estadísticas en otros países:
AfghanistanAlbaniaAlgeriaAmerican SamoaAndorraAngolaAntigua and BarbudaArab WorldArgentinaArmeniaArubaAustraliaAustriaAzerbaijanBahamas, TheBahrainBangladeshBarbadosBelarusBelgiumBelizeBeninBermudaBhutanBoliviaBosnia and HerzegovinaBotswanaBrazilBritish Virgin IslandsBrunei DarussalamBulgariaBurkina FasoBurundiCabo VerdeCambodiaCameroonCanadaCaribbean small statesCayman IslandsCentral African RepublicCentral Europe and the BalticsChadChileChinaColombiaComorosCongo, Dem. Rep.Congo, Rep.Costa RicaCote d'IvoireCroatiaCubaCuracaoCyprusCzech RepublicDenmarkDjiboutiDominicaDominican RepublicEarly-demographic dividendEast Asia & PacificEast Asia & Pacific (excluding high income)East Asia & Pacific (IDA & IBRD countries)EcuadorEgypt, Arab Rep.El SalvadorEquatorial GuineaEritreaEstoniaEthiopiaEuro areaEurope & Central AsiaEurope & Central Asia (excluding high income)Europe & Central Asia (IDA & IBRD countries)European UnionFaroe IslandsFijiFinlandFragile and conflict affected situationsFranceFrench PolynesiaGabonGambia, TheGeorgiaGermanyGhanaGibraltarGreeceGreenlandGrenadaGuamGuatemalaGuineaGuinea-BissauGuyanaHaitiHeavily indebted poor countries (HIPC)High incomeHondurasHong Kong SAR, ChinaHungaryIBRD onlyIcelandIDA & IBRD totalIDA blendIDA onlyIDA totalIndiaIndonesiaIran, Islamic Rep.IraqIrelandIsraelItalyJamaicaJapanJordanKazakhstanKenyaKiribatiKorea, Dem. People’s Rep.Korea, Rep.KosovoKuwaitKyrgyz RepublicLao PDRLate-demographic dividendLatin America & Caribbean Latin America & Caribbean (excluding high income)Latin America & the Caribbean (IDA & IBRD countries)LatviaLeast developed countries: UN classificationLebanonLesothoLiberiaLibyaLiechtensteinLithuaniaLow & middle incomeLow incomeLower middle incomeLuxembourgMacao SAR, ChinaMacedonia, FYRMadagascarMalawiMalaysiaMaldivesMaliMaltaMarshall IslandsMauritaniaMauritiusMexicoMicronesia, Fed. Sts.Middle East & North AfricaMiddle East & North Africa (excluding high income)Middle East & North Africa (IDA & IBRD countries)Middle incomeMoldovaMonacoMongoliaMontenegroMoroccoMozambiqueMyanmarNamibiaNauruNepalNetherlandsNew CaledoniaNew ZealandNicaraguaNigerNigeriaNorth AmericaNorthern Mariana IslandsNorwayOECD membersOmanOther small statesPacific island small statesPakistanPalauPanamaPapua New GuineaParaguayPeruPhilippinesPolandPortugalPost-demographic dividendPre-demographic dividendPuerto RicoQatarRomaniaRussian FederationRwandaSamoaSan MarinoSao Tome and PrincipeSaudi ArabiaSenegalSerbiaSeychellesSierra LeoneSingaporeSlovak RepublicSloveniaSmall statesSolomon IslandsSomaliaSouth AfricaSouth AsiaSouth Asia (IDA & IBRD)South SudanSpainSri LankaSt. Kitts and NevisSt. LuciaSt. Vincent and the GrenadinesSub-Saharan Africa Sub-Saharan Africa (excluding high income)Sub-Saharan Africa (IDA & IBRD countries)SudanSurinameSwazilandSwedenSwitzerlandSyrian Arab RepublicTajikistanTanzaniaThailandTimor-LesteTogoTongaTrinidad and TobagoTunisiaTurkeyTurkmenistanTurks and Caicos IslandsTuvaluUgandaUkraineUnited Arab EmiratesUnited KingdomUnited StatesUpper middle incomeUruguayUzbekistanVanuatuVenezuela, RBVietnamVirgin Islands (U.S.)West Bank and GazaWorldYemen, Rep.ZambiaZimbabwe línea de tiempo (timeline):
En esta escala de tiempo se presenta un gráfico de 1966 y 2016 de Greenland. Los datos de 1965 están ausentes. El número de observaciones reales por fecha: 43.
Fuente (nombre):
Indicadores del desarrollo mundial
Fuente (organización):
International Telecommunication Union, World Telecommunication/ICT Development Report and database.
Categorías:
Infrastructure
Se ha actualizado:
23 abr 2017 año
Los indicadores de los cambios de valor en los últimos años
Mínimo:
1.528
1 ene 1966 año
Máximo:
63.211
1 ene 2007 año
A la fecha de observación
Valor
Cambio absoluto
El cambio con respecto al valor anterior
1 ene 1966 año
1.528
+1.528
0.0%
1 ene 1971 año
3.386
+1.858
121.61%
1 ene 1976 año
9.425
+6.039
178.36%
1 ene 1977 año
10.955
+1.531
16.24%
1 ene 1978 año
12.023
+1.067
9.74%
1 ene 1979 año
14.265
+2.242
18.65%
1 ene 1980 año
16.692
+2.427
17.01%
1 ene 1981 año
19.051
+2.359
14.13%
1 ene 1982 año
19.972
+0.921
4.83%
1 ene 1983 año
20.957
+0.985
4.93%
1 ene 1984 año
21.337
+0.381
1.82%
1 ene 1985 año
22.405
+1.068
5.01%
1 ene 1986 año
23.172
+0.767
3.42%
1 ene 1987 año
24.722
+1.55
6.69%
1 ene 1988 año
27.09
+2.368
9.58%
1 ene 1989 año
28.712
+1.622
5.99%
1 ene 1990 año
29.95
+1.237
4.31%
1 ene 1991 año
29.863
-0.086
-0.29%
1 ene 1992 año
30.061
+0.198
0.66%
1 ene 1993 año
30.186
+0.125
0.41%
1 ene 1994 año
31.435
+1.249
4.14%
1 ene 1995 año
33.099
+1.664
5.29%
1 ene 1996 año
35.118
+2.019
6.1%
1 ene 1997 año
37.821
+2.703
7.7%
1 ene 1998 año
41.809
+3.988
10.54%
1 ene 1999 año
44.627
+2.819
6.74%
1 ene 2000 año
45.705
+1.077
2.41%
1 ene 2001 año
46.605
+0.901
1.97%
1 ene 2002 año
42.986
-3.619
-7.77%
1 ene 2003 año
44.805
+1.819
4.23%
1 ene 2004 año
44.504
-0.301
-0.67%
1 ene 2005 año
44.176
-0.328
-0.74%
1 ene 2006 año
56.452
+12.275
27.79%
1 ene 2007 año
63.211
+6.759
11.97%
1 ene 2008 año
40.761
-22.451
-35.52%
1 ene 2009 año
40.261
-0.5
-1.23%
1 ene 2010 año
38.961
-1.3
-3.23%
1 ene 2011 año
38.592
-0.37
-0.95%
1 ene 2012 año
35.136
-3.456
-8.95%
1 ene 2013 año
33.3
-1.836
-5.23%
1 ene 2014 año
31.586
-1.714
-5.15%
1 ene 2015 año
30.089
-1.497
-4.74%
1 ene 2016 año
27.935
-2.153
-7.16%
Ranking de los países por los datos estadísticos actuales


Comentarios: