29
/es/
es
AIzaSyAYiBZKx7MnpbEhh9jyipgxe19OcubqV5w
April 1, 2024
193004
Mauritania
MRT
true
2
1
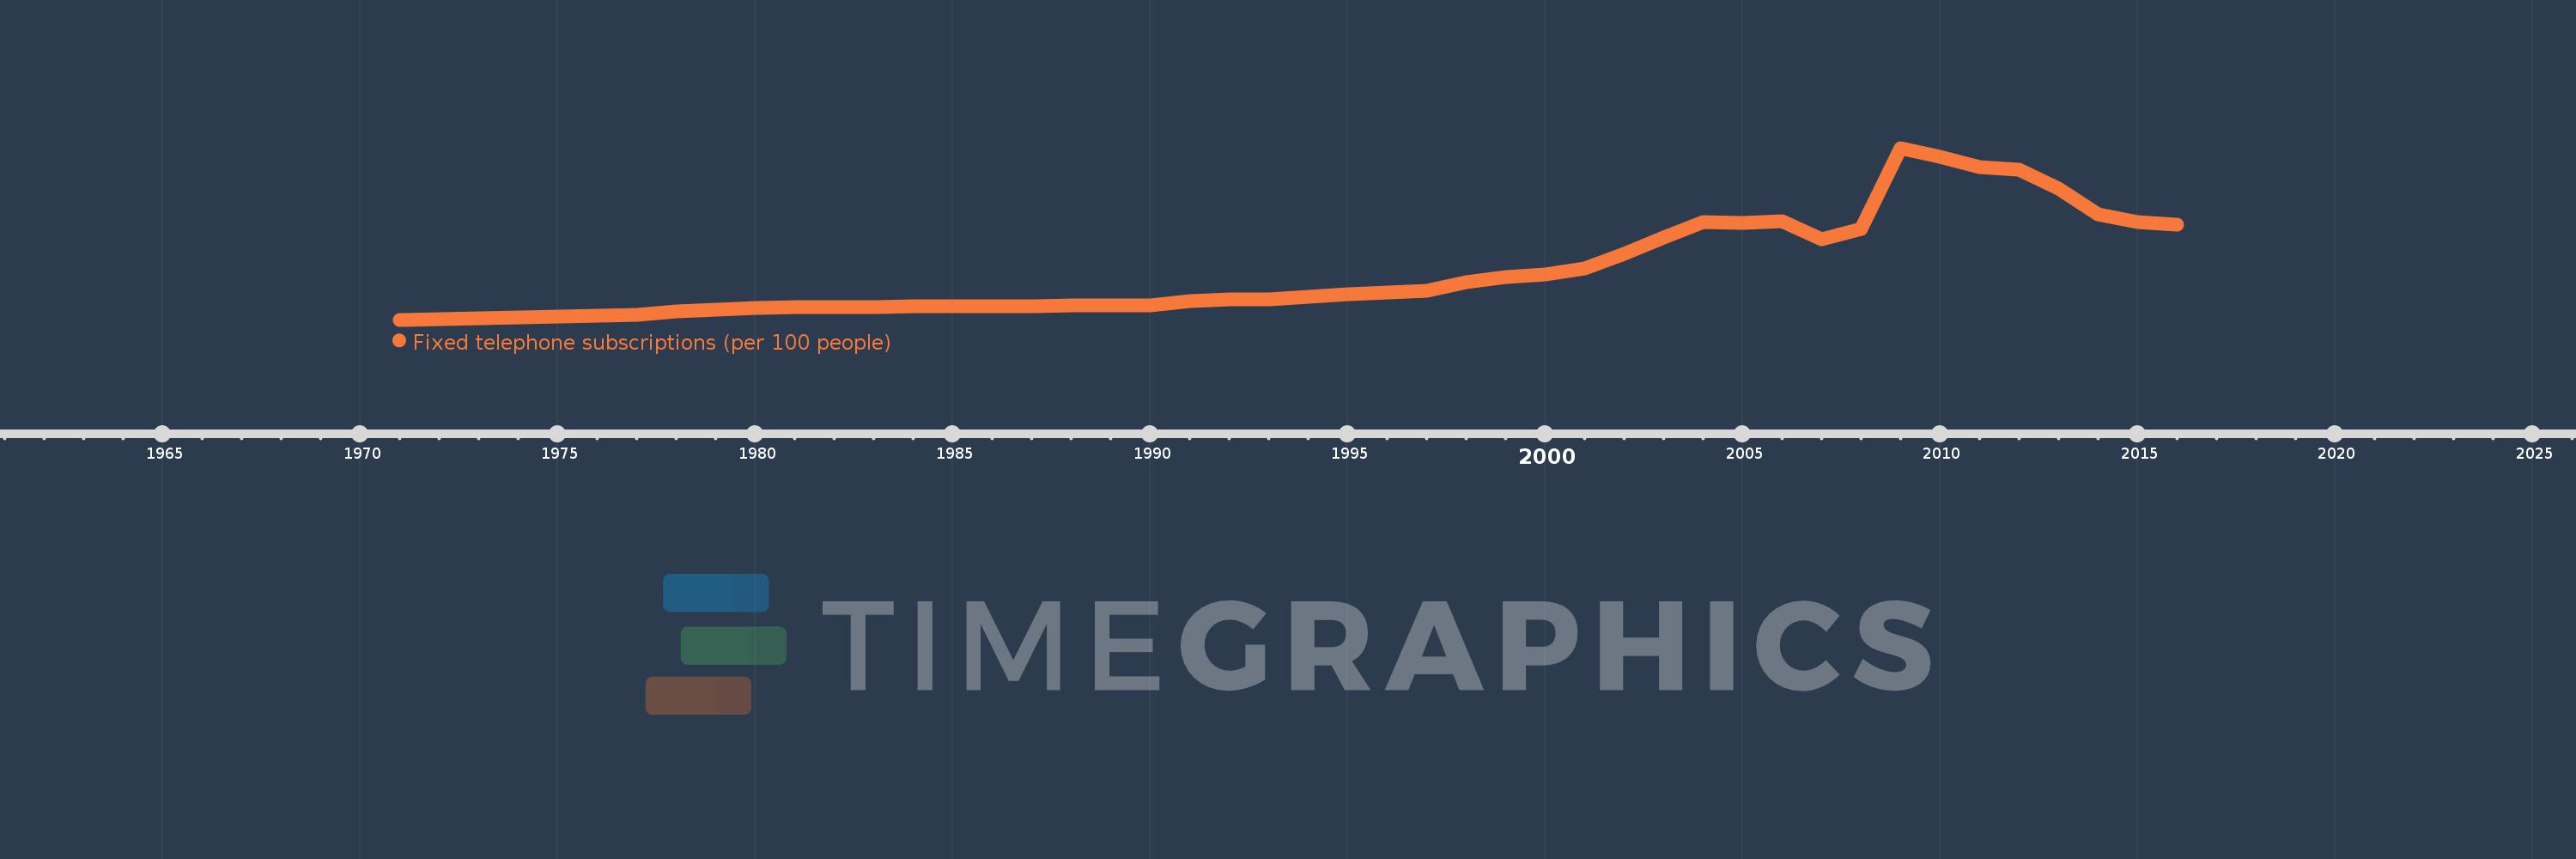
Fixed telephone subscriptions (per 100 people)
2016,2015,2014,2013,2012,2011,2010,2009,2008,2007,2006,2005,2004,2003,2002,2001,2000,1999,1998,1997,1996,1995,1994,1993,1992,1991,1990,1989,1988,1987,1986,1985,1984,1983,1982,1981,1980,1979,1978,1977,1976,1971
Estas estadísticas en otros países:
AfghanistanAlbaniaAlgeriaAmerican SamoaAndorraAngolaAntigua and BarbudaArab WorldArgentinaArmeniaArubaAustraliaAustriaAzerbaijanBahamas, TheBahrainBangladeshBarbadosBelarusBelgiumBelizeBeninBermudaBhutanBoliviaBosnia and HerzegovinaBotswanaBrazilBritish Virgin IslandsBrunei DarussalamBulgariaBurkina FasoBurundiCabo VerdeCambodiaCameroonCanadaCaribbean small statesCayman IslandsCentral African RepublicCentral Europe and the BalticsChadChileChinaColombiaComorosCongo, Dem. Rep.Congo, Rep.Costa RicaCote d'IvoireCroatiaCubaCuracaoCyprusCzech RepublicDenmarkDjiboutiDominicaDominican RepublicEarly-demographic dividendEast Asia & PacificEast Asia & Pacific (excluding high income)East Asia & Pacific (IDA & IBRD countries)EcuadorEgypt, Arab Rep.El SalvadorEquatorial GuineaEritreaEstoniaEthiopiaEuro areaEurope & Central AsiaEurope & Central Asia (excluding high income)Europe & Central Asia (IDA & IBRD countries)European UnionFaroe IslandsFijiFinlandFragile and conflict affected situationsFranceFrench PolynesiaGabonGambia, TheGeorgiaGermanyGhanaGibraltarGreeceGreenlandGrenadaGuamGuatemalaGuineaGuinea-BissauGuyanaHaitiHeavily indebted poor countries (HIPC)High incomeHondurasHong Kong SAR, ChinaHungaryIBRD onlyIcelandIDA & IBRD totalIDA blendIDA onlyIDA totalIndiaIndonesiaIran, Islamic Rep.IraqIrelandIsraelItalyJamaicaJapanJordanKazakhstanKenyaKiribatiKorea, Dem. People’s Rep.Korea, Rep.KosovoKuwaitKyrgyz RepublicLao PDRLate-demographic dividendLatin America & Caribbean Latin America & Caribbean (excluding high income)Latin America & the Caribbean (IDA & IBRD countries)LatviaLeast developed countries: UN classificationLebanonLesothoLiberiaLibyaLiechtensteinLithuaniaLow & middle incomeLow incomeLower middle incomeLuxembourgMacao SAR, ChinaMacedonia, FYRMadagascarMalawiMalaysiaMaldivesMaliMaltaMarshall IslandsMauritaniaMauritiusMexicoMicronesia, Fed. Sts.Middle East & North AfricaMiddle East & North Africa (excluding high income)Middle East & North Africa (IDA & IBRD countries)Middle incomeMoldovaMonacoMongoliaMontenegroMoroccoMozambiqueMyanmarNamibiaNauruNepalNetherlandsNew CaledoniaNew ZealandNicaraguaNigerNigeriaNorth AmericaNorthern Mariana IslandsNorwayOECD membersOmanOther small statesPacific island small statesPakistanPalauPanamaPapua New GuineaParaguayPeruPhilippinesPolandPortugalPost-demographic dividendPre-demographic dividendPuerto RicoQatarRomaniaRussian FederationRwandaSamoaSan MarinoSao Tome and PrincipeSaudi ArabiaSenegalSerbiaSeychellesSierra LeoneSingaporeSlovak RepublicSloveniaSmall statesSolomon IslandsSomaliaSouth AfricaSouth AsiaSouth Asia (IDA & IBRD)South SudanSpainSri LankaSt. Kitts and NevisSt. LuciaSt. Vincent and the GrenadinesSub-Saharan Africa Sub-Saharan Africa (excluding high income)Sub-Saharan Africa (IDA & IBRD countries)SudanSurinameSwazilandSwedenSwitzerlandSyrian Arab RepublicTajikistanTanzaniaThailandTimor-LesteTogoTongaTrinidad and TobagoTunisiaTurkeyTurkmenistanTurks and Caicos IslandsTuvaluUgandaUkraineUnited Arab EmiratesUnited KingdomUnited StatesUpper middle incomeUruguayUzbekistanVanuatuVenezuela, RBVietnamVirgin Islands (U.S.)West Bank and GazaWorldYemen, Rep.ZambiaZimbabwe línea de tiempo (timeline):
En esta escala de tiempo se presenta un gráfico de 1971 y 2016 de Mauritania. Los datos de 1970 están ausentes. El número de observaciones reales por fecha: 42.
Fuente (nombre):
Indicadores del desarrollo mundial
Fuente (organización):
International Telecommunication Union, World Telecommunication/ICT Development Report and database.
Categorías:
Infrastructure
Se ha actualizado:
23 abr 2017 año
Los indicadores de los cambios de valor en los últimos años
Mínimo:
0.052
1 ene 1971 año
Máximo:
2.231
1 ene 2009 año
A la fecha de observación
Valor
Cambio absoluto
El cambio con respecto al valor anterior
1 ene 1971 año
0.052
+0.052
0.0%
1 ene 1976 año
0.1
+0.048
91.54%
1 ene 1977 año
0.112
+0.012
12.14%
1 ene 1978 año
0.157
+0.045
40.23%
1 ene 1979 año
0.177
+0.02
12.66%
1 ene 1980 año
0.2
+0.023
13.15%
1 ene 1981 año
0.212
+0.012
5.86%
1 ene 1982 año
0.212
0.0
-0.02%
1 ene 1983 año
0.216
+0.004
1.85%
1 ene 1984 año
0.222
+0.006
2.82%
1 ene 1985 año
0.22
-0.003
-1.15%
1 ene 1986 año
0.224
+0.004
1.83%
1 ene 1987 año
0.226
+0.003
1.17%
1 ene 1988 año
0.231
+0.005
2.07%
1 ene 1989 año
0.236
+0.005
2.02%
1 ene 1990 año
0.23
-0.005
-2.2%
1 ene 1991 año
0.29
+0.06
26.03%
1 ene 1992 año
0.307
+0.016
5.55%
1 ene 1993 año
0.315
+0.009
2.82%
1 ene 1994 año
0.34
+0.025
7.97%
1 ene 1995 año
0.372
+0.031
9.17%
1 ene 1996 año
0.396
+0.025
6.62%
1 ene 1997 año
0.424
+0.028
7.14%
1 ene 1998 año
0.527
+0.102
24.13%
1 ene 1999 año
0.589
+0.062
11.85%
1 ene 2000 año
0.629
+0.04
6.71%
1 ene 2001 año
0.7
+0.072
11.38%
1 ene 2002 año
0.89
+0.19
27.12%
1 ene 2003 año
1.096
+0.205
23.05%
1 ene 2004 año
1.287
+0.192
17.49%
1 ene 2005 año
1.276
-0.011
-0.85%
1 ene 2006 año
1.303
+0.027
2.1%
1 ene 2007 año
1.077
-0.226
-17.36%
1 ene 2008 año
1.209
+0.132
12.28%
1 ene 2009 año
2.231
+1.021
84.47%
1 ene 2010 año
2.118
-0.113
-5.06%
1 ene 2011 año
1.983
-0.135
-6.37%
1 ene 2012 año
1.952
-0.03
-1.54%
1 ene 2013 año
1.714
-0.238
-12.21%
1 ene 2014 año
1.388
-0.326
-19.02%
1 ene 2015 año
1.291
-0.097
-7.0%
1 ene 2016 año
1.257
-0.034
-2.61%
Ranking de los países por los datos estadísticos actuales


Comentarios: