29
/es/
es
AIzaSyAYiBZKx7MnpbEhh9jyipgxe19OcubqV5w
April 1, 2024
41433
Latin America & Caribbean
LCN
false
2
1
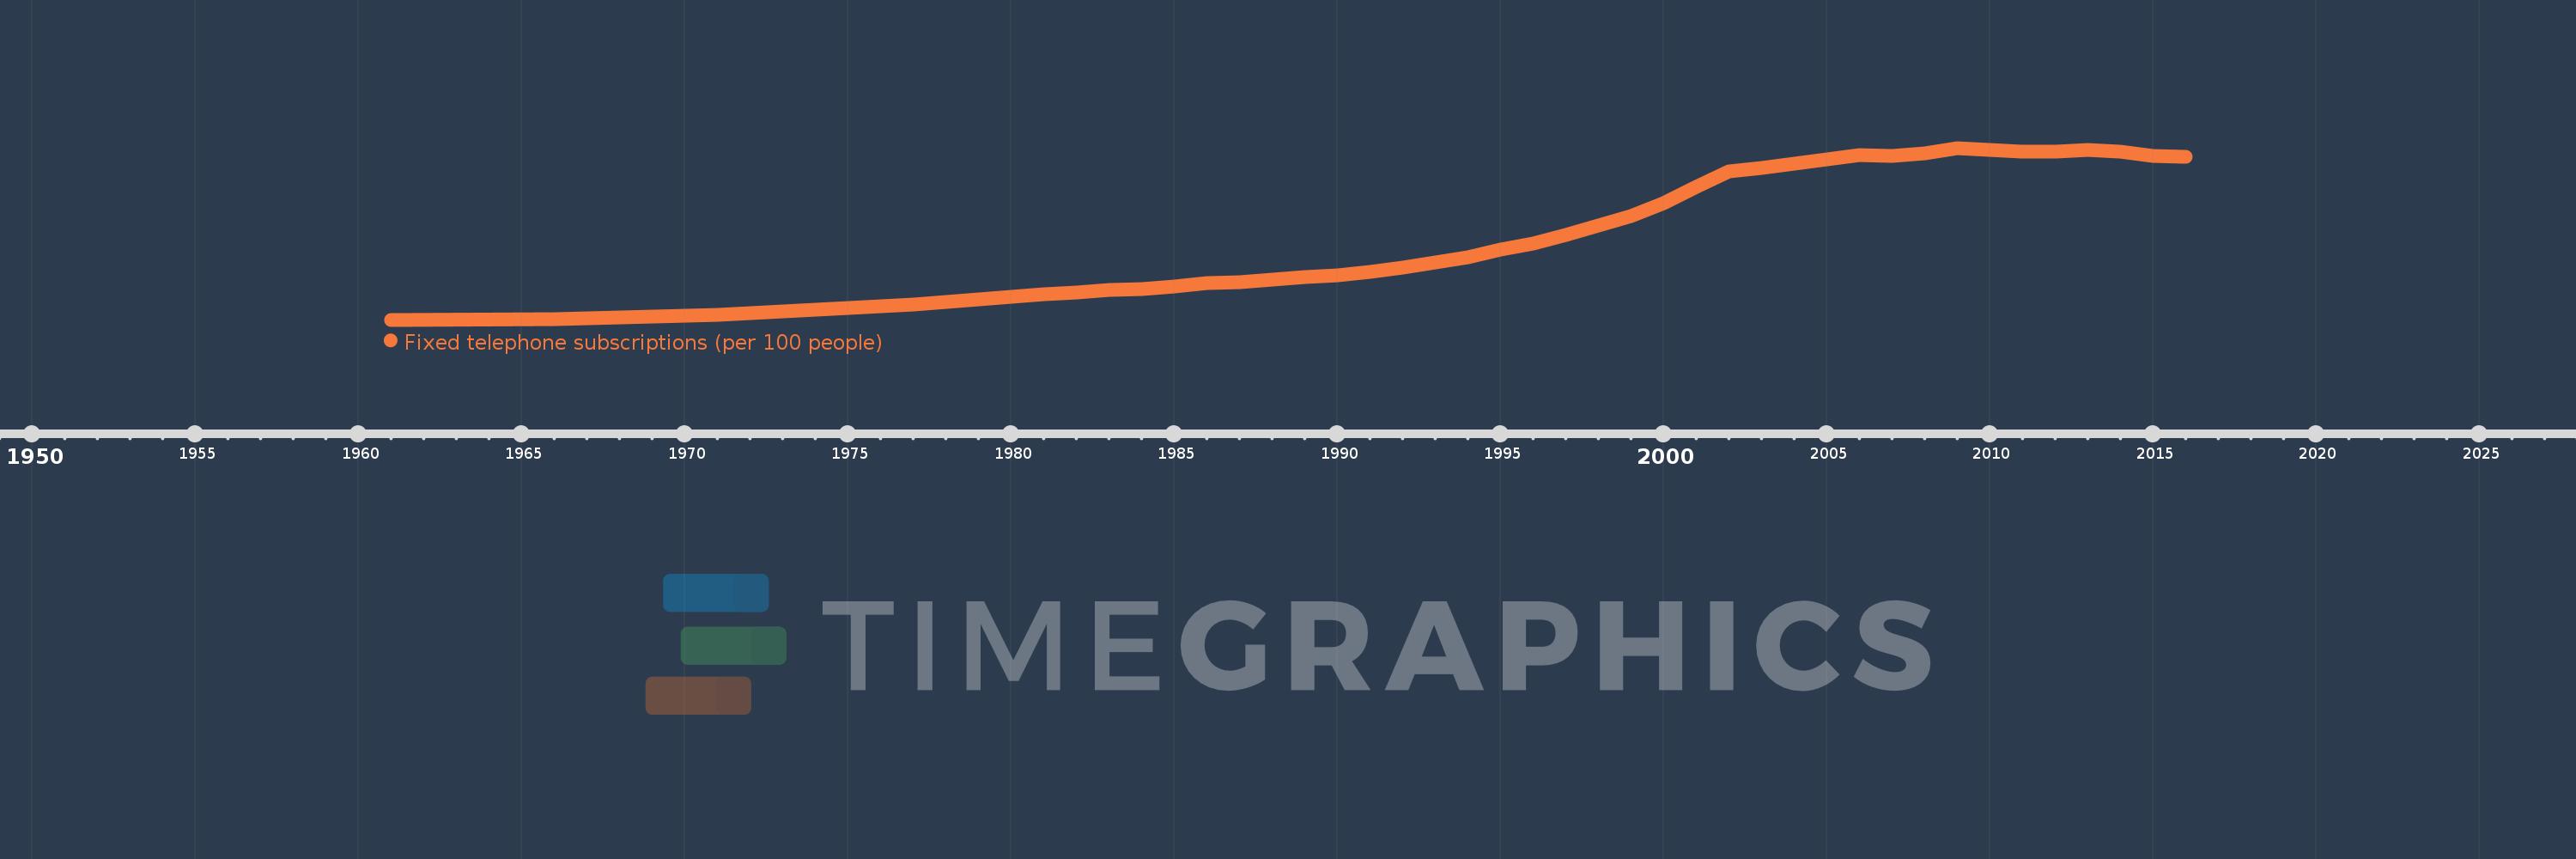
Fixed telephone subscriptions (per 100 people)
2016,2015,2014,2013,2012,2011,2010,2009,2008,2007,2006,2005,2004,2003,2002,2001,2000,1999,1998,1997,1996,1995,1994,1993,1992,1991,1990,1989,1988,1987,1986,1985,1984,1983,1982,1981,1980,1979,1978,1977,1976,1971,1966,1961
Estas estadísticas en otros países:
AfghanistanAlbaniaAlgeriaAmerican SamoaAndorraAngolaAntigua and BarbudaArab WorldArgentinaArmeniaArubaAustraliaAustriaAzerbaijanBahamas, TheBahrainBangladeshBarbadosBelarusBelgiumBelizeBeninBermudaBhutanBoliviaBosnia and HerzegovinaBotswanaBrazilBritish Virgin IslandsBrunei DarussalamBulgariaBurkina FasoBurundiCabo VerdeCambodiaCameroonCanadaCaribbean small statesCayman IslandsCentral African RepublicCentral Europe and the BalticsChadChileChinaColombiaComorosCongo, Dem. Rep.Congo, Rep.Costa RicaCote d'IvoireCroatiaCubaCuracaoCyprusCzech RepublicDenmarkDjiboutiDominicaDominican RepublicEarly-demographic dividendEast Asia & PacificEast Asia & Pacific (excluding high income)East Asia & Pacific (IDA & IBRD countries)EcuadorEgypt, Arab Rep.El SalvadorEquatorial GuineaEritreaEstoniaEthiopiaEuro areaEurope & Central AsiaEurope & Central Asia (excluding high income)Europe & Central Asia (IDA & IBRD countries)European UnionFaroe IslandsFijiFinlandFragile and conflict affected situationsFranceFrench PolynesiaGabonGambia, TheGeorgiaGermanyGhanaGibraltarGreeceGreenlandGrenadaGuamGuatemalaGuineaGuinea-BissauGuyanaHaitiHeavily indebted poor countries (HIPC)High incomeHondurasHong Kong SAR, ChinaHungaryIBRD onlyIcelandIDA & IBRD totalIDA blendIDA onlyIDA totalIndiaIndonesiaIran, Islamic Rep.IraqIrelandIsraelItalyJamaicaJapanJordanKazakhstanKenyaKiribatiKorea, Dem. People’s Rep.Korea, Rep.KosovoKuwaitKyrgyz RepublicLao PDRLate-demographic dividendLatin America & Caribbean Latin America & Caribbean (excluding high income)Latin America & the Caribbean (IDA & IBRD countries)LatviaLeast developed countries: UN classificationLebanonLesothoLiberiaLibyaLiechtensteinLithuaniaLow & middle incomeLow incomeLower middle incomeLuxembourgMacao SAR, ChinaMacedonia, FYRMadagascarMalawiMalaysiaMaldivesMaliMaltaMarshall IslandsMauritaniaMauritiusMexicoMicronesia, Fed. Sts.Middle East & North AfricaMiddle East & North Africa (excluding high income)Middle East & North Africa (IDA & IBRD countries)Middle incomeMoldovaMonacoMongoliaMontenegroMoroccoMozambiqueMyanmarNamibiaNauruNepalNetherlandsNew CaledoniaNew ZealandNicaraguaNigerNigeriaNorth AmericaNorthern Mariana IslandsNorwayOECD membersOmanOther small statesPacific island small statesPakistanPalauPanamaPapua New GuineaParaguayPeruPhilippinesPolandPortugalPost-demographic dividendPre-demographic dividendPuerto RicoQatarRomaniaRussian FederationRwandaSamoaSan MarinoSao Tome and PrincipeSaudi ArabiaSenegalSerbiaSeychellesSierra LeoneSingaporeSlovak RepublicSloveniaSmall statesSolomon IslandsSomaliaSouth AfricaSouth AsiaSouth Asia (IDA & IBRD)South SudanSpainSri LankaSt. Kitts and NevisSt. LuciaSt. Vincent and the GrenadinesSub-Saharan Africa Sub-Saharan Africa (excluding high income)Sub-Saharan Africa (IDA & IBRD countries)SudanSurinameSwazilandSwedenSwitzerlandSyrian Arab RepublicTajikistanTanzaniaThailandTimor-LesteTogoTongaTrinidad and TobagoTunisiaTurkeyTurkmenistanTurks and Caicos IslandsTuvaluUgandaUkraineUnited Arab EmiratesUnited KingdomUnited StatesUpper middle incomeUruguayUzbekistanVanuatuVenezuela, RBVietnamVirgin Islands (U.S.)West Bank and GazaWorldYemen, Rep.ZambiaZimbabwe línea de tiempo (timeline):
En esta escala de tiempo se presenta un gráfico de 1961 y 2016 de Latin America & Caribbean . Los datos de 1960 están ausentes. El número de observaciones reales por fecha: 44.
Fuente (nombre):
Indicadores del desarrollo mundial
Fuente (organización):
International Telecommunication Union, World Telecommunication/ICT Development Report and database.
Categorías:
Infrastructure
Se ha actualizado:
23 abr 2017 año
Los indicadores de los cambios de valor en los últimos años
Mínimo:
1.514
1 ene 1961 año
Máximo:
18.336
1 ene 2009 año
A la fecha de observación
Valor
Cambio absoluto
El cambio con respecto al valor anterior
1 ene 1961 año
1.514
+1.514
0.0%
1 ene 1966 año
1.608
+0.093
6.17%
1 ene 1971 año
2.011
+0.403
25.1%
1 ene 1976 año
2.824
+0.813
40.43%
1 ene 1977 año
2.976
+0.152
5.39%
1 ene 1978 año
3.233
+0.257
8.63%
1 ene 1979 año
3.53
+0.297
9.18%
1 ene 1980 año
3.767
+0.236
6.69%
1 ene 1981 año
4.015
+0.249
6.6%
1 ene 1982 año
4.162
+0.147
3.65%
1 ene 1983 año
4.407
+0.245
5.9%
1 ene 1984 año
4.536
+0.129
2.93%
1 ene 1985 año
4.808
+0.272
5.99%
1 ene 1986 año
5.065
+0.257
5.34%
1 ene 1987 año
5.218
+0.153
3.01%
1 ene 1988 año
5.418
+0.2
3.84%
1 ene 1989 año
5.66
+0.243
4.48%
1 ene 1990 año
5.861
+0.2
3.54%
1 ene 1991 año
6.22
+0.359
6.13%
1 ene 1992 año
6.605
+0.385
6.19%
1 ene 1993 año
7.156
+0.551
8.35%
1 ene 1994 año
7.667
+0.511
7.15%
1 ene 1995 año
8.397
+0.73
9.52%
1 ene 1996 año
8.991
+0.594
7.07%
1 ene 1997 año
9.798
+0.807
8.97%
1 ene 1998 año
10.729
+0.931
9.5%
1 ene 1999 año
11.668
+0.938
8.75%
1 ene 2000 año
12.922
+1.255
10.75%
1 ene 2001 año
14.524
+1.602
12.39%
1 ene 2002 año
16.01
+1.486
10.23%
1 ene 2003 año
16.373
+0.363
2.27%
1 ene 2004 año
16.767
+0.394
2.4%
1 ene 2005 año
17.191
+0.424
2.53%
1 ene 2006 año
17.61
+0.419
2.44%
1 ene 2007 año
17.535
-0.075
-0.43%
1 ene 2008 año
17.792
+0.258
1.47%
1 ene 2009 año
18.336
+0.544
3.06%
1 ene 2010 año
18.109
-0.227
-1.24%
1 ene 2011 año
17.943
-0.166
-0.92%
1 ene 2012 año
17.944
+0.001
0.01%
1 ene 2013 año
18.102
+0.158
0.88%
1 ene 2014 año
17.983
-0.119
-0.66%
1 ene 2015 año
17.54
-0.443
-2.46%
1 ene 2016 año
17.442
-0.098
-0.56%
Ranking de los países por los datos estadísticos actuales


Comentarios: