29
/es/
es
AIzaSyAYiBZKx7MnpbEhh9jyipgxe19OcubqV5w
April 1, 2024
51128
Middle income
MIC
false
2
1
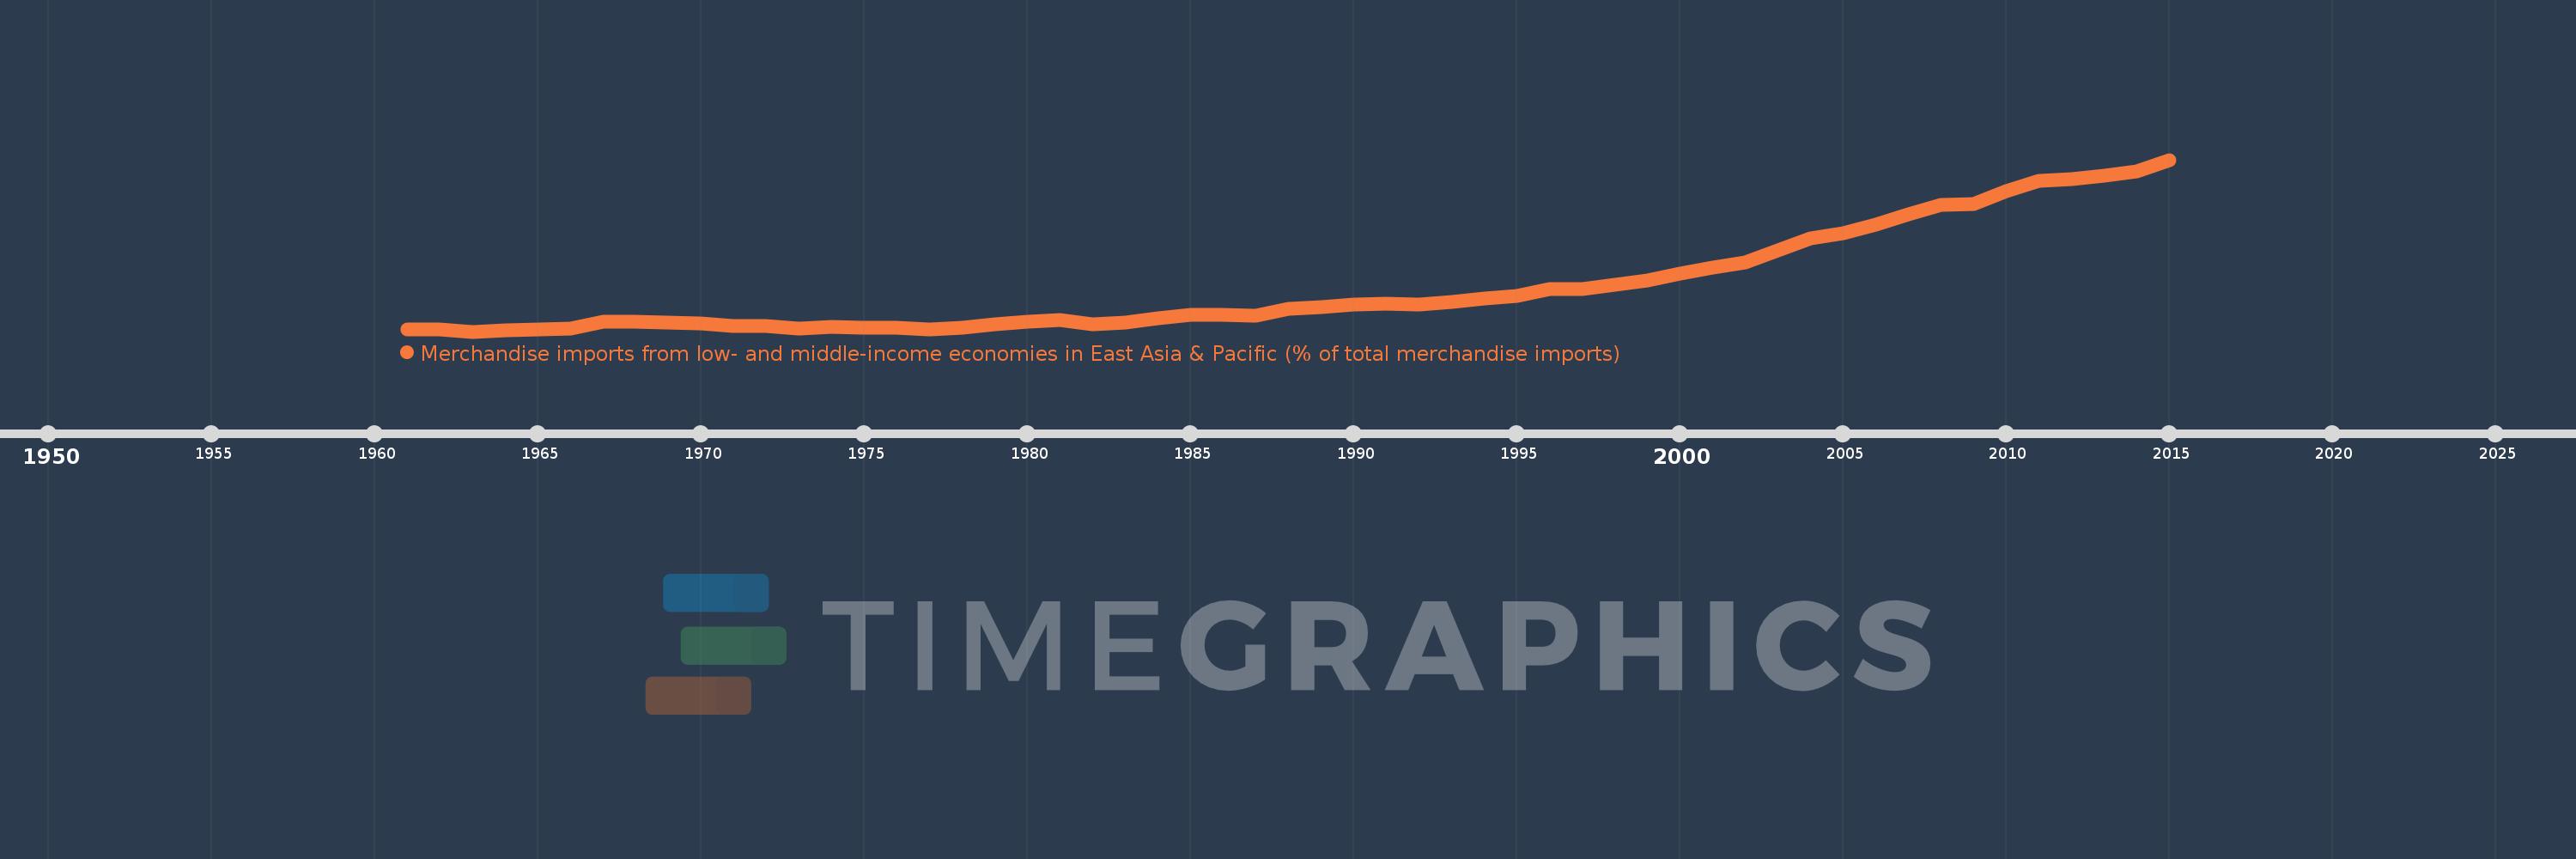
Merchandise imports from low- and middle-income economies in East Asia & Pacific (% of total merchandise imports)
2015,2014,2013,2012,2011,2010,2009,2008,2007,2006,2005,2004,2003,2002,2001,2000,1999,1998,1997,1996,1995,1994,1993,1992,1991,1990,1989,1988,1987,1986,1985,1984,1983,1982,1981,1980,1979,1978,1977,1976,1975,1974,1973,1972,1971,1970,1969,1968,1967,1966,1965,1964,1963,1962,1961
Estas estadísticas en otros países:
AfghanistanAlbaniaAlgeriaArab WorldArgentinaArmeniaArubaAustraliaAustriaAzerbaijanBahamas, TheBahrainBangladeshBarbadosBelarusBelgiumBelizeBeninBermudaBoliviaBrazilBrunei DarussalamBulgariaBurkina FasoBurundiCabo VerdeCambodiaCameroonCanadaCaribbean small statesCentral African RepublicCentral Europe and the BalticsChileChinaColombiaCongo, Rep.Costa RicaCote d'IvoireCroatiaCyprusCzech RepublicDenmarkDominicaDominican RepublicEarly-demographic dividendEast Asia & PacificEast Asia & Pacific (excluding high income)East Asia & Pacific (IDA & IBRD countries)EcuadorEgypt, Arab Rep.El SalvadorEstoniaEthiopiaEuro areaEurope & Central AsiaEurope & Central Asia (excluding high income)Europe & Central Asia (IDA & IBRD countries)European UnionFijiFinlandFragile and conflict affected situationsFranceFrench PolynesiaGabonGambia, TheGeorgiaGermanyGhanaGreeceGreenlandGrenadaGuatemalaHaitiHeavily indebted poor countries (HIPC)High incomeHondurasHong Kong SAR, ChinaHungaryIBRD onlyIcelandIDA & IBRD totalIDA blendIDA onlyIDA totalIndiaIndonesiaIran, Islamic Rep.IraqIrelandIsraelItalyJamaicaJapanJordanKazakhstanKenyaKorea, Dem. People’s Rep.Korea, Rep.KuwaitKyrgyz RepublicLao PDRLate-demographic dividendLatin America & Caribbean Latin America & Caribbean (excluding high income)Latin America & the Caribbean (IDA & IBRD countries)LatviaLeast developed countries: UN classificationLebanonLithuaniaLow & middle incomeLow incomeLower middle incomeLuxembourgMacao SAR, ChinaMacedonia, FYRMadagascarMalaysiaMaliMaltaMauritiusMexicoMiddle East & North AfricaMiddle East & North Africa (excluding high income)Middle East & North Africa (IDA & IBRD countries)Middle incomeMoldovaMongoliaMontenegroMoroccoMyanmarNetherlandsNew CaledoniaNew ZealandNicaraguaNigerNigeriaNorth AmericaNorwayOECD membersOmanOther small statesPacific island small statesPakistanPanamaPapua New GuineaParaguayPeruPhilippinesPolandPortugalPost-demographic dividendPre-demographic dividendQatarRomaniaRussian FederationSamoaSaudi ArabiaSenegalSerbiaSingaporeSlovak RepublicSloveniaSmall statesSolomon IslandsSomaliaSouth AfricaSouth AsiaSouth Asia (IDA & IBRD)SpainSri LankaSt. Kitts and NevisSt. LuciaSt. Vincent and the GrenadinesSub-Saharan Africa Sub-Saharan Africa (excluding high income)Sub-Saharan Africa (IDA & IBRD countries)SurinameSwedenSwitzerlandTanzaniaThailandTogoTongaTrinidad and TobagoTunisiaTurkeyUgandaUkraineUnited Arab EmiratesUnited KingdomUnited StatesUpper middle incomeUruguayVanuatuVenezuela, RBVietnamWorldYemen, Rep.ZambiaZimbabwe línea de tiempo (timeline):
En esta escala de tiempo se presenta un gráfico de 1961 y 2015 de Middle income. Los datos de 1960 están ausentes. El número de observaciones reales por fecha: 55.
Fuente (nombre):
Indicadores del desarrollo mundial
Fuente (organización):
World Bank staff estimates based data from International Monetary Fund's Direction of Trade database.
Categorías:
Private Sector, Trade
Se ha actualizado:
23 abr 2017 año
Los indicadores de los cambios de valor en los últimos años
Mínimo:
1.084
1 ene 1963 año
Máximo:
17.694
1 ene 2015 año
A la fecha de observación
Valor
Cambio absoluto
El cambio con respecto al valor anterior
1 ene 1961 año
1.267
+1.267
0.0%
1 ene 1962 año
1.262
-0.005
-0.38%
1 ene 1963 año
1.084
-0.178
-14.1%
1 ene 1964 año
1.234
+0.15
13.86%
1 ene 1965 año
1.266
+0.031
2.54%
1 ene 1966 año
1.336
+0.07
5.54%
1 ene 1967 año
2.061
+0.725
54.29%
1 ene 1968 año
2.034
-0.027
-1.32%
1 ene 1969 año
1.972
-0.062
-3.06%
1 ene 1970 año
1.869
-0.103
-5.21%
1 ene 1971 año
1.655
-0.214
-11.47%
1 ene 1972 año
1.611
-0.044
-2.63%
1 ene 1973 año
1.353
-0.258
-16.0%
1 ene 1974 año
1.501
+0.147
10.89%
1 ene 1975 año
1.444
-0.057
-3.78%
1 ene 1976 año
1.433
-0.011
-0.74%
1 ene 1977 año
1.309
-0.124
-8.65%
1 ene 1978 año
1.439
+0.13
9.92%
1 ene 1979 año
1.815
+0.376
26.11%
1 ene 1980 año
2.055
+0.24
13.21%
1 ene 1981 año
2.183
+0.128
6.24%
1 ene 1982 año
1.751
-0.432
-19.79%
1 ene 1983 año
1.977
+0.226
12.93%
1 ene 1984 año
2.336
+0.359
18.16%
1 ene 1985 año
2.728
+0.392
16.78%
1 ene 1986 año
2.718
-0.011
-0.39%
1 ene 1987 año
2.634
-0.084
-3.09%
1 ene 1988 año
3.278
+0.645
24.48%
1 ene 1989 año
3.442
+0.163
4.98%
1 ene 1990 año
3.665
+0.223
6.49%
1 ene 1991 año
3.812
+0.147
4.0%
1 ene 1992 año
3.72
-0.091
-2.39%
1 ene 1993 año
3.961
+0.241
6.47%
1 ene 1994 año
4.263
+0.301
7.61%
1 ene 1995 año
4.496
+0.234
5.48%
1 ene 1996 año
5.236
+0.739
16.44%
1 ene 1997 año
5.23
-0.006
-0.11%
1 ene 1998 año
5.651
+0.421
8.05%
1 ene 1999 año
6.063
+0.412
7.29%
1 ene 2000 año
6.682
+0.62
10.22%
1 ene 2001 año
7.234
+0.552
8.25%
1 ene 2002 año
7.738
+0.504
6.97%
1 ene 2003 año
8.952
+1.214
15.69%
1 ene 2004 año
10.055
+1.102
12.31%
1 ene 2005 año
10.606
+0.552
5.49%
1 ene 2006 año
11.445
+0.838
7.9%
1 ene 2007 año
12.447
+1.002
8.76%
1 ene 2008 año
13.305
+0.858
6.9%
1 ene 2009 año
13.406
+0.101
0.76%
1 ene 2010 año
14.651
+1.245
9.28%
1 ene 2011 año
15.628
+0.978
6.67%
1 ene 2012 año
15.842
+0.214
1.37%
1 ene 2013 año
16.118
+0.275
1.74%
1 ene 2014 año
16.548
+0.43
2.67%
1 ene 2015 año
17.694
+1.146
6.93%
Ranking de los países por los datos estadísticos actuales


Comentarios: