29
/es/
es
AIzaSyAYiBZKx7MnpbEhh9jyipgxe19OcubqV5w
April 1, 2024
42626
Latin America & Caribbean (excluding high income)
LAC
false
2
1
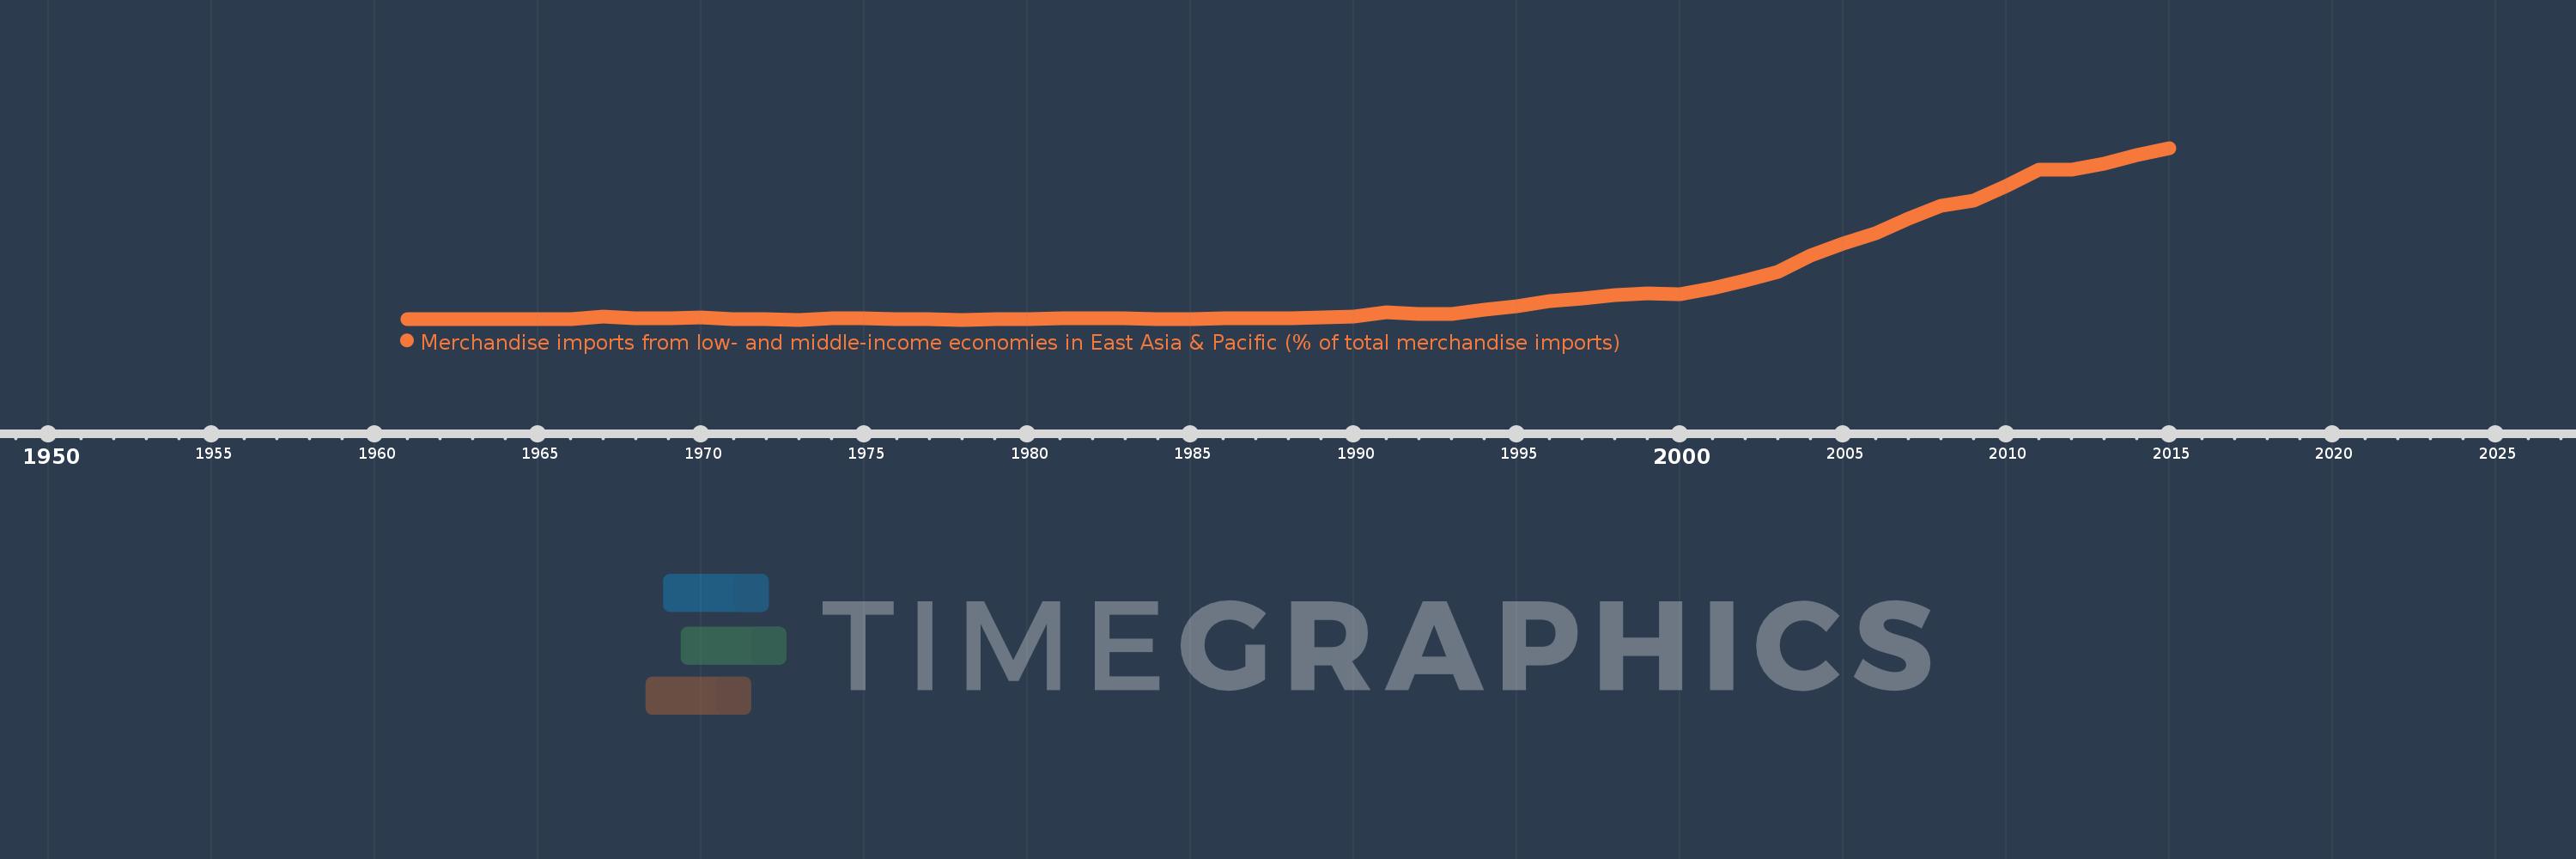
Merchandise imports from low- and middle-income economies in East Asia & Pacific (% of total merchandise imports)
2015,2014,2013,2012,2011,2010,2009,2008,2007,2006,2005,2004,2003,2002,2001,2000,1999,1998,1997,1996,1995,1994,1993,1992,1991,1990,1989,1988,1987,1986,1985,1984,1983,1982,1981,1980,1979,1978,1977,1976,1975,1974,1973,1972,1971,1970,1969,1968,1967,1966,1965,1964,1963,1962,1961
Estas estadísticas en otros países:
AfghanistanAlbaniaAlgeriaArab WorldArgentinaArmeniaArubaAustraliaAustriaAzerbaijanBahamas, TheBahrainBangladeshBarbadosBelarusBelgiumBelizeBeninBermudaBoliviaBrazilBrunei DarussalamBulgariaBurkina FasoBurundiCabo VerdeCambodiaCameroonCanadaCaribbean small statesCentral African RepublicCentral Europe and the BalticsChileChinaColombiaCongo, Rep.Costa RicaCote d'IvoireCroatiaCyprusCzech RepublicDenmarkDominicaDominican RepublicEarly-demographic dividendEast Asia & PacificEast Asia & Pacific (excluding high income)East Asia & Pacific (IDA & IBRD countries)EcuadorEgypt, Arab Rep.El SalvadorEstoniaEthiopiaEuro areaEurope & Central AsiaEurope & Central Asia (excluding high income)Europe & Central Asia (IDA & IBRD countries)European UnionFijiFinlandFragile and conflict affected situationsFranceFrench PolynesiaGabonGambia, TheGeorgiaGermanyGhanaGreeceGreenlandGrenadaGuatemalaHaitiHeavily indebted poor countries (HIPC)High incomeHondurasHong Kong SAR, ChinaHungaryIBRD onlyIcelandIDA & IBRD totalIDA blendIDA onlyIDA totalIndiaIndonesiaIran, Islamic Rep.IraqIrelandIsraelItalyJamaicaJapanJordanKazakhstanKenyaKorea, Dem. People’s Rep.Korea, Rep.KuwaitKyrgyz RepublicLao PDRLate-demographic dividendLatin America & Caribbean Latin America & Caribbean (excluding high income)Latin America & the Caribbean (IDA & IBRD countries)LatviaLeast developed countries: UN classificationLebanonLithuaniaLow & middle incomeLow incomeLower middle incomeLuxembourgMacao SAR, ChinaMacedonia, FYRMadagascarMalaysiaMaliMaltaMauritiusMexicoMiddle East & North AfricaMiddle East & North Africa (excluding high income)Middle East & North Africa (IDA & IBRD countries)Middle incomeMoldovaMongoliaMontenegroMoroccoMyanmarNetherlandsNew CaledoniaNew ZealandNicaraguaNigerNigeriaNorth AmericaNorwayOECD membersOmanOther small statesPacific island small statesPakistanPanamaPapua New GuineaParaguayPeruPhilippinesPolandPortugalPost-demographic dividendPre-demographic dividendQatarRomaniaRussian FederationSamoaSaudi ArabiaSenegalSerbiaSingaporeSlovak RepublicSloveniaSmall statesSolomon IslandsSomaliaSouth AfricaSouth AsiaSouth Asia (IDA & IBRD)SpainSri LankaSt. Kitts and NevisSt. LuciaSt. Vincent and the GrenadinesSub-Saharan Africa Sub-Saharan Africa (excluding high income)Sub-Saharan Africa (IDA & IBRD countries)SurinameSwedenSwitzerlandTanzaniaThailandTogoTongaTrinidad and TobagoTunisiaTurkeyUgandaUkraineUnited Arab EmiratesUnited KingdomUnited StatesUpper middle incomeUruguayVanuatuVenezuela, RBVietnamWorldYemen, Rep.ZambiaZimbabwe línea de tiempo (timeline):
En esta escala de tiempo se presenta un gráfico de 1961 y 2015 de Latin America & Caribbean (excluding high income). Los datos de 1960 están ausentes. El número de observaciones reales por fecha: 55.
Fuente (nombre):
Indicadores del desarrollo mundial
Fuente (organización):
World Bank staff estimates based data from International Monetary Fund's Direction of Trade database.
Categorías:
Private Sector, Trade
Se ha actualizado:
23 abr 2017 año
Los indicadores de los cambios de valor en los últimos años
Mínimo:
0.087
1 ene 1973 año
Máximo:
18.489
1 ene 2015 año
A la fecha de observación
Valor
Cambio absoluto
El cambio con respecto al valor anterior
1 ene 1961 año
0.179
+0.179
0.0%
1 ene 1962 año
0.111
-0.068
-38.1%
1 ene 1963 año
0.116
+0.005
4.54%
1 ene 1964 año
0.114
-0.002
-1.54%
1 ene 1965 año
0.145
+0.031
27.61%
1 ene 1966 año
0.185
+0.039
27.02%
1 ene 1967 año
0.392
+0.207
112.03%
1 ene 1968 año
0.26
-0.131
-33.48%
1 ene 1969 año
0.252
-0.008
-3.19%
1 ene 1970 año
0.324
+0.072
28.52%
1 ene 1971 año
0.16
-0.164
-50.5%
1 ene 1972 año
0.12
-0.04
-25.16%
1 ene 1973 año
0.087
-0.033
-27.73%
1 ene 1974 año
0.237
+0.15
172.67%
1 ene 1975 año
0.219
-0.018
-7.53%
1 ene 1976 año
0.138
-0.081
-36.82%
1 ene 1977 año
0.11
-0.028
-20.45%
1 ene 1978 año
0.103
-0.007
-5.91%
1 ene 1979 año
0.188
+0.085
82.16%
1 ene 1980 año
0.195
+0.007
3.63%
1 ene 1981 año
0.234
+0.038
19.63%
1 ene 1982 año
0.265
+0.031
13.34%
1 ene 1983 año
0.234
-0.031
-11.58%
1 ene 1984 año
0.149
-0.085
-36.34%
1 ene 1985 año
0.163
+0.014
9.13%
1 ene 1986 año
0.198
+0.035
21.68%
1 ene 1987 año
0.218
+0.02
10.12%
1 ene 1988 año
0.288
+0.07
32.3%
1 ene 1989 año
0.376
+0.087
30.25%
1 ene 1990 año
0.431
+0.056
14.79%
1 ene 1991 año
0.85
+0.419
97.21%
1 ene 1992 año
0.693
-0.157
-18.5%
1 ene 1993 año
0.667
-0.026
-3.69%
1 ene 1994 año
1.191
+0.524
78.47%
1 ene 1995 año
1.553
+0.362
30.41%
1 ene 1996 año
2.103
+0.55
35.4%
1 ene 1997 año
2.329
+0.226
10.73%
1 ene 1998 año
2.711
+0.382
16.4%
1 ene 1999 año
2.888
+0.177
6.53%
1 ene 2000 año
2.798
-0.09
-3.1%
1 ene 2001 año
3.435
+0.637
22.77%
1 ene 2002 año
4.321
+0.886
25.79%
1 ene 2003 año
5.174
+0.853
19.75%
1 ene 2004 año
6.975
+1.801
34.81%
1 ene 2005 año
8.266
+1.291
18.51%
1 ene 2006 año
9.315
+1.048
12.68%
1 ene 2007 año
10.941
+1.626
17.45%
1 ene 2008 año
12.313
+1.373
12.55%
1 ene 2009 año
12.822
+0.509
4.13%
1 ene 2010 año
14.416
+1.593
12.43%
1 ene 2011 año
16.123
+1.707
11.84%
1 ene 2012 año
16.174
+0.051
0.32%
1 ene 2013 año
16.817
+0.643
3.97%
1 ene 2014 año
17.761
+0.944
5.61%
1 ene 2015 año
18.489
+0.728
4.1%
Ranking de los países por los datos estadísticos actuales


Comentarios: