29
/es/
es
AIzaSyAYiBZKx7MnpbEhh9jyipgxe19OcubqV5w
April 1, 2024
222484
Peru
PER
true
2
1
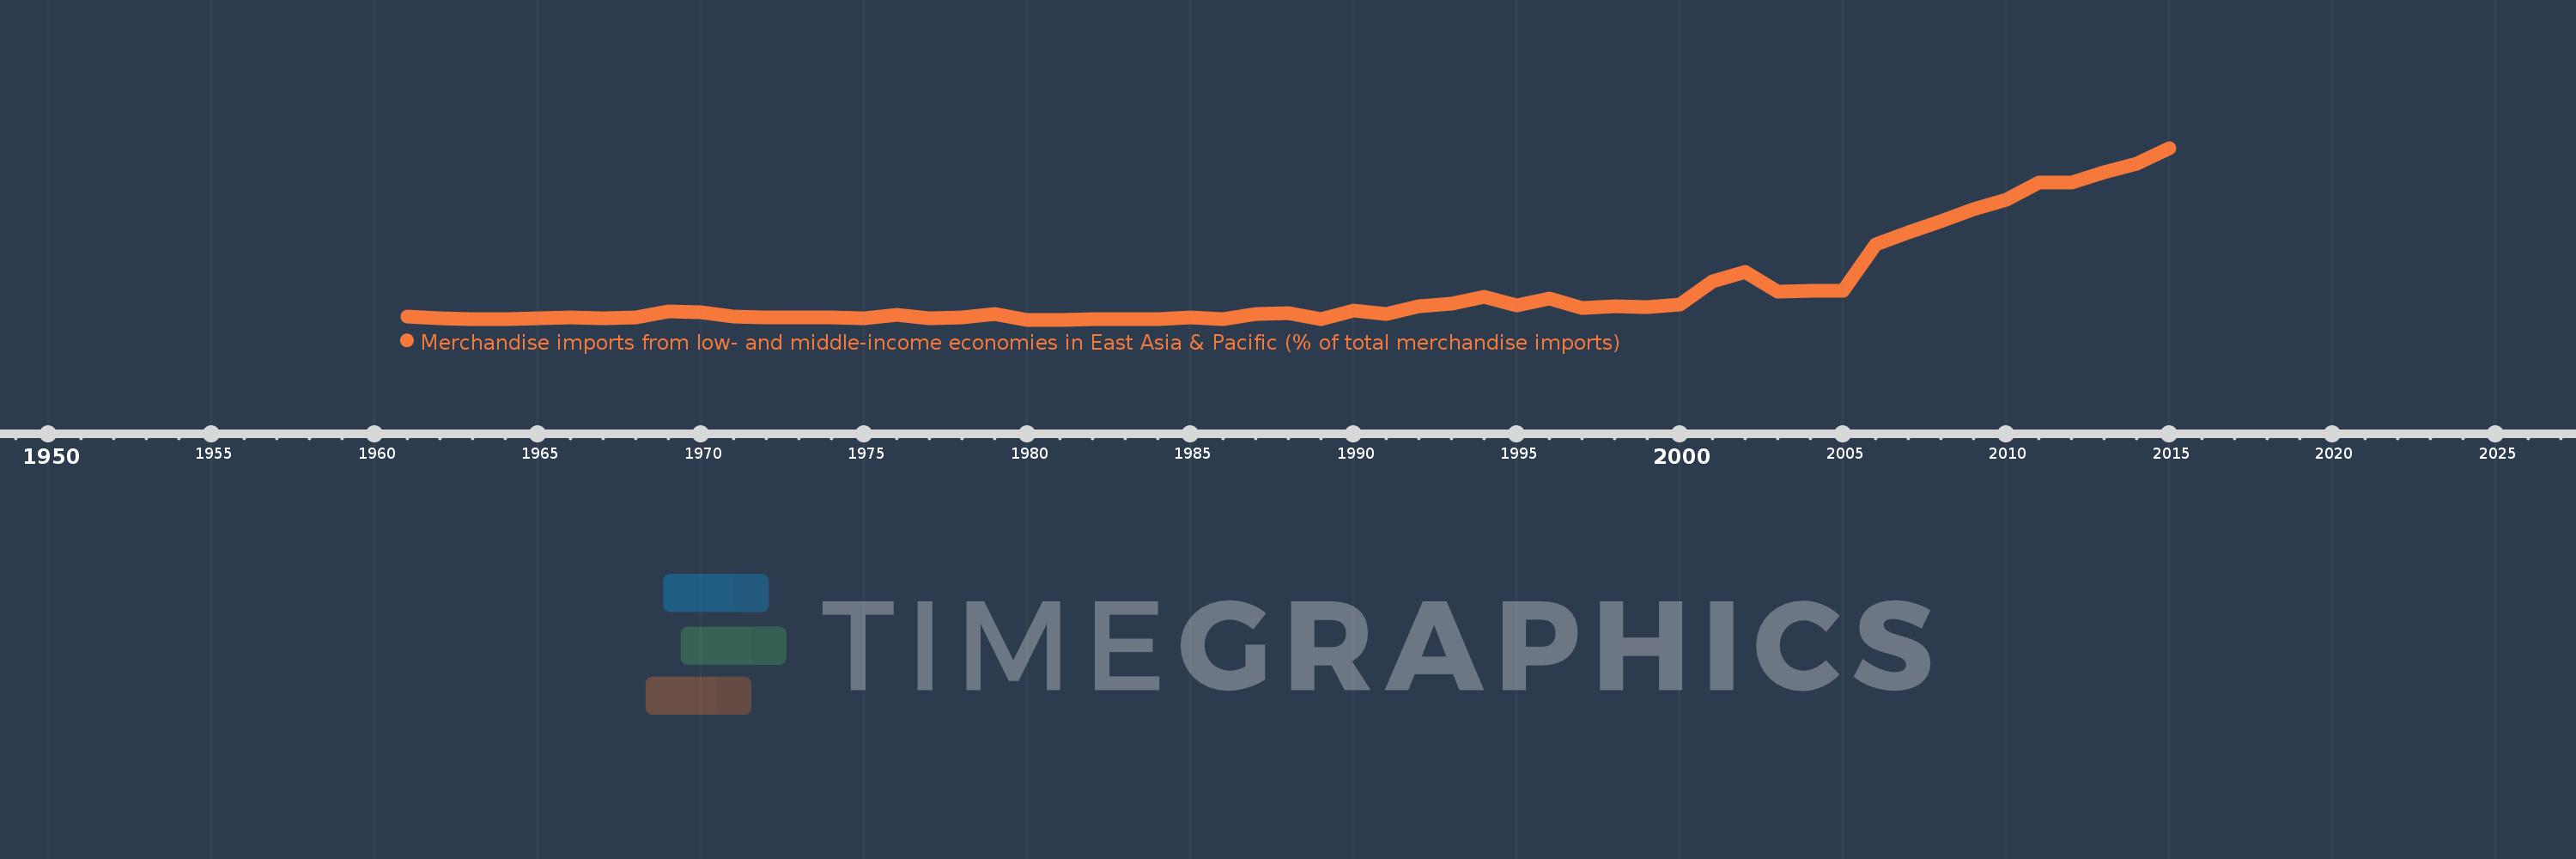
Merchandise imports from low- and middle-income economies in East Asia & Pacific (% of total merchandise imports)
2015,2014,2013,2012,2011,2010,2009,2008,2007,2006,2005,2004,2003,2002,2001,2000,1999,1998,1997,1996,1995,1994,1993,1992,1991,1990,1989,1988,1987,1986,1985,1984,1983,1982,1981,1980,1979,1978,1977,1976,1975,1974,1973,1972,1971,1970,1969,1968,1967,1966,1965,1964,1963,1962,1961
Estas estadísticas en otros países:
AfghanistanAlbaniaAlgeriaArab WorldArgentinaArmeniaArubaAustraliaAustriaAzerbaijanBahamas, TheBahrainBangladeshBarbadosBelarusBelgiumBelizeBeninBermudaBoliviaBrazilBrunei DarussalamBulgariaBurkina FasoBurundiCabo VerdeCambodiaCameroonCanadaCaribbean small statesCentral African RepublicCentral Europe and the BalticsChileChinaColombiaCongo, Rep.Costa RicaCote d'IvoireCroatiaCyprusCzech RepublicDenmarkDominicaDominican RepublicEarly-demographic dividendEast Asia & PacificEast Asia & Pacific (excluding high income)East Asia & Pacific (IDA & IBRD countries)EcuadorEgypt, Arab Rep.El SalvadorEstoniaEthiopiaEuro areaEurope & Central AsiaEurope & Central Asia (excluding high income)Europe & Central Asia (IDA & IBRD countries)European UnionFijiFinlandFragile and conflict affected situationsFranceFrench PolynesiaGabonGambia, TheGeorgiaGermanyGhanaGreeceGreenlandGrenadaGuatemalaHaitiHeavily indebted poor countries (HIPC)High incomeHondurasHong Kong SAR, ChinaHungaryIBRD onlyIcelandIDA & IBRD totalIDA blendIDA onlyIDA totalIndiaIndonesiaIran, Islamic Rep.IraqIrelandIsraelItalyJamaicaJapanJordanKazakhstanKenyaKorea, Dem. People’s Rep.Korea, Rep.KuwaitKyrgyz RepublicLao PDRLate-demographic dividendLatin America & Caribbean Latin America & Caribbean (excluding high income)Latin America & the Caribbean (IDA & IBRD countries)LatviaLeast developed countries: UN classificationLebanonLithuaniaLow & middle incomeLow incomeLower middle incomeLuxembourgMacao SAR, ChinaMacedonia, FYRMadagascarMalaysiaMaliMaltaMauritiusMexicoMiddle East & North AfricaMiddle East & North Africa (excluding high income)Middle East & North Africa (IDA & IBRD countries)Middle incomeMoldovaMongoliaMontenegroMoroccoMyanmarNetherlandsNew CaledoniaNew ZealandNicaraguaNigerNigeriaNorth AmericaNorwayOECD membersOmanOther small statesPacific island small statesPakistanPanamaPapua New GuineaParaguayPeruPhilippinesPolandPortugalPost-demographic dividendPre-demographic dividendQatarRomaniaRussian FederationSamoaSaudi ArabiaSenegalSerbiaSingaporeSlovak RepublicSloveniaSmall statesSolomon IslandsSomaliaSouth AfricaSouth AsiaSouth Asia (IDA & IBRD)SpainSri LankaSt. Kitts and NevisSt. LuciaSt. Vincent and the GrenadinesSub-Saharan Africa Sub-Saharan Africa (excluding high income)Sub-Saharan Africa (IDA & IBRD countries)SurinameSwedenSwitzerlandTanzaniaThailandTogoTongaTrinidad and TobagoTunisiaTurkeyUgandaUkraineUnited Arab EmiratesUnited KingdomUnited StatesUpper middle incomeUruguayVanuatuVenezuela, RBVietnamWorldYemen, Rep.ZambiaZimbabwe línea de tiempo (timeline):
En esta escala de tiempo se presenta un gráfico de 1961 y 2015 de Peru. Los datos de 1960 están ausentes. El número de observaciones reales por fecha: 55.
Fuente (nombre):
Indicadores del desarrollo mundial
Fuente (organización):
World Bank staff estimates based data from International Monetary Fund's Direction of Trade database.
Categorías:
Private Sector, Trade
Se ha actualizado:
23 abr 2017 año
Los indicadores de los cambios de valor en los últimos años
Mínimo:
0.034
1 ene 1981 año
Máximo:
24.244
1 ene 2015 año
A la fecha de observación
Valor
Cambio absoluto
El cambio con respecto al valor anterior
1 ene 1961 año
0.429
+0.429
0.0%
1 ene 1962 año
0.256
-0.173
-40.3%
1 ene 1963 año
0.149
-0.107
-41.79%
1 ene 1964 año
0.162
+0.013
8.42%
1 ene 1965 año
0.19
+0.028
17.6%
1 ene 1966 año
0.316
+0.125
66.03%
1 ene 1967 año
0.257
-0.059
-18.56%
1 ene 1968 año
0.369
+0.112
43.52%
1 ene 1969 año
1.174
+0.806
218.42%
1 ene 1970 año
1.072
-0.103
-8.73%
1 ene 1971 año
0.511
-0.561
-52.36%
1 ene 1972 año
0.407
-0.104
-20.38%
1 ene 1973 año
0.36
-0.047
-11.49%
1 ene 1974 año
0.317
-0.043
-11.94%
1 ene 1975 año
0.287
-0.03
-9.33%
1 ene 1976 año
0.749
+0.462
160.73%
1 ene 1977 año
0.241
-0.508
-67.77%
1 ene 1978 año
0.392
+0.151
62.55%
1 ene 1979 año
0.815
+0.422
107.61%
1 ene 1980 año
0.056
-0.759
-93.11%
1 ene 1981 año
0.034
-0.022
-39.84%
1 ene 1982 año
0.064
+0.03
89.66%
1 ene 1983 año
0.101
+0.037
57.44%
1 ene 1984 año
0.078
-0.023
-22.49%
1 ene 1985 año
0.407
+0.329
420.5%
1 ene 1986 año
0.112
-0.295
-72.38%
1 ene 1987 año
0.903
+0.791
703.95%
1 ene 1988 año
0.968
+0.065
7.19%
1 ene 1989 año
0.164
-0.804
-83.04%
1 ene 1990 año
1.324
+1.16
706.1%
1 ene 1991 año
0.88
-0.444
-33.51%
1 ene 1992 año
1.978
+1.098
124.73%
1 ene 1993 año
2.249
+0.271
13.7%
1 ene 1994 año
3.208
+0.959
42.64%
1 ene 1995 año
2.05
-1.158
-36.09%
1 ene 1996 año
2.964
+0.914
44.58%
1 ene 1997 año
1.65
-1.314
-44.34%
1 ene 1998 año
1.889
+0.239
14.47%
1 ene 1999 año
1.85
-0.039
-2.07%
1 ene 2000 año
2.148
+0.298
16.11%
1 ene 2001 año
5.419
+3.271
152.32%
1 ene 2002 año
6.738
+1.319
24.34%
1 ene 2003 año
3.961
-2.777
-41.21%
1 ene 2004 año
4.074
+0.112
2.84%
1 ene 2005 año
4.061
-0.013
-0.31%
1 ene 2006 año
10.616
+6.555
161.42%
1 ene 2007 año
12.319
+1.703
16.04%
1 ene 2008 año
13.973
+1.654
13.43%
1 ene 2009 año
15.672
+1.699
12.16%
1 ene 2010 año
17.004
+1.332
8.5%
1 ene 2011 año
19.385
+2.381
14.01%
1 ene 2012 año
19.392
+0.006
0.03%
1 ene 2013 año
20.856
+1.464
7.55%
1 ene 2014 año
22.041
+1.184
5.68%
1 ene 2015 año
24.244
+2.203
10.0%
Ranking de los países por los datos estadísticos actuales


Comentarios: