29
/es/
es
AIzaSyAYiBZKx7MnpbEhh9jyipgxe19OcubqV5w
April 1, 2024
35160
Heavily indebted poor countries (HIPC)
HPC
false
2
1
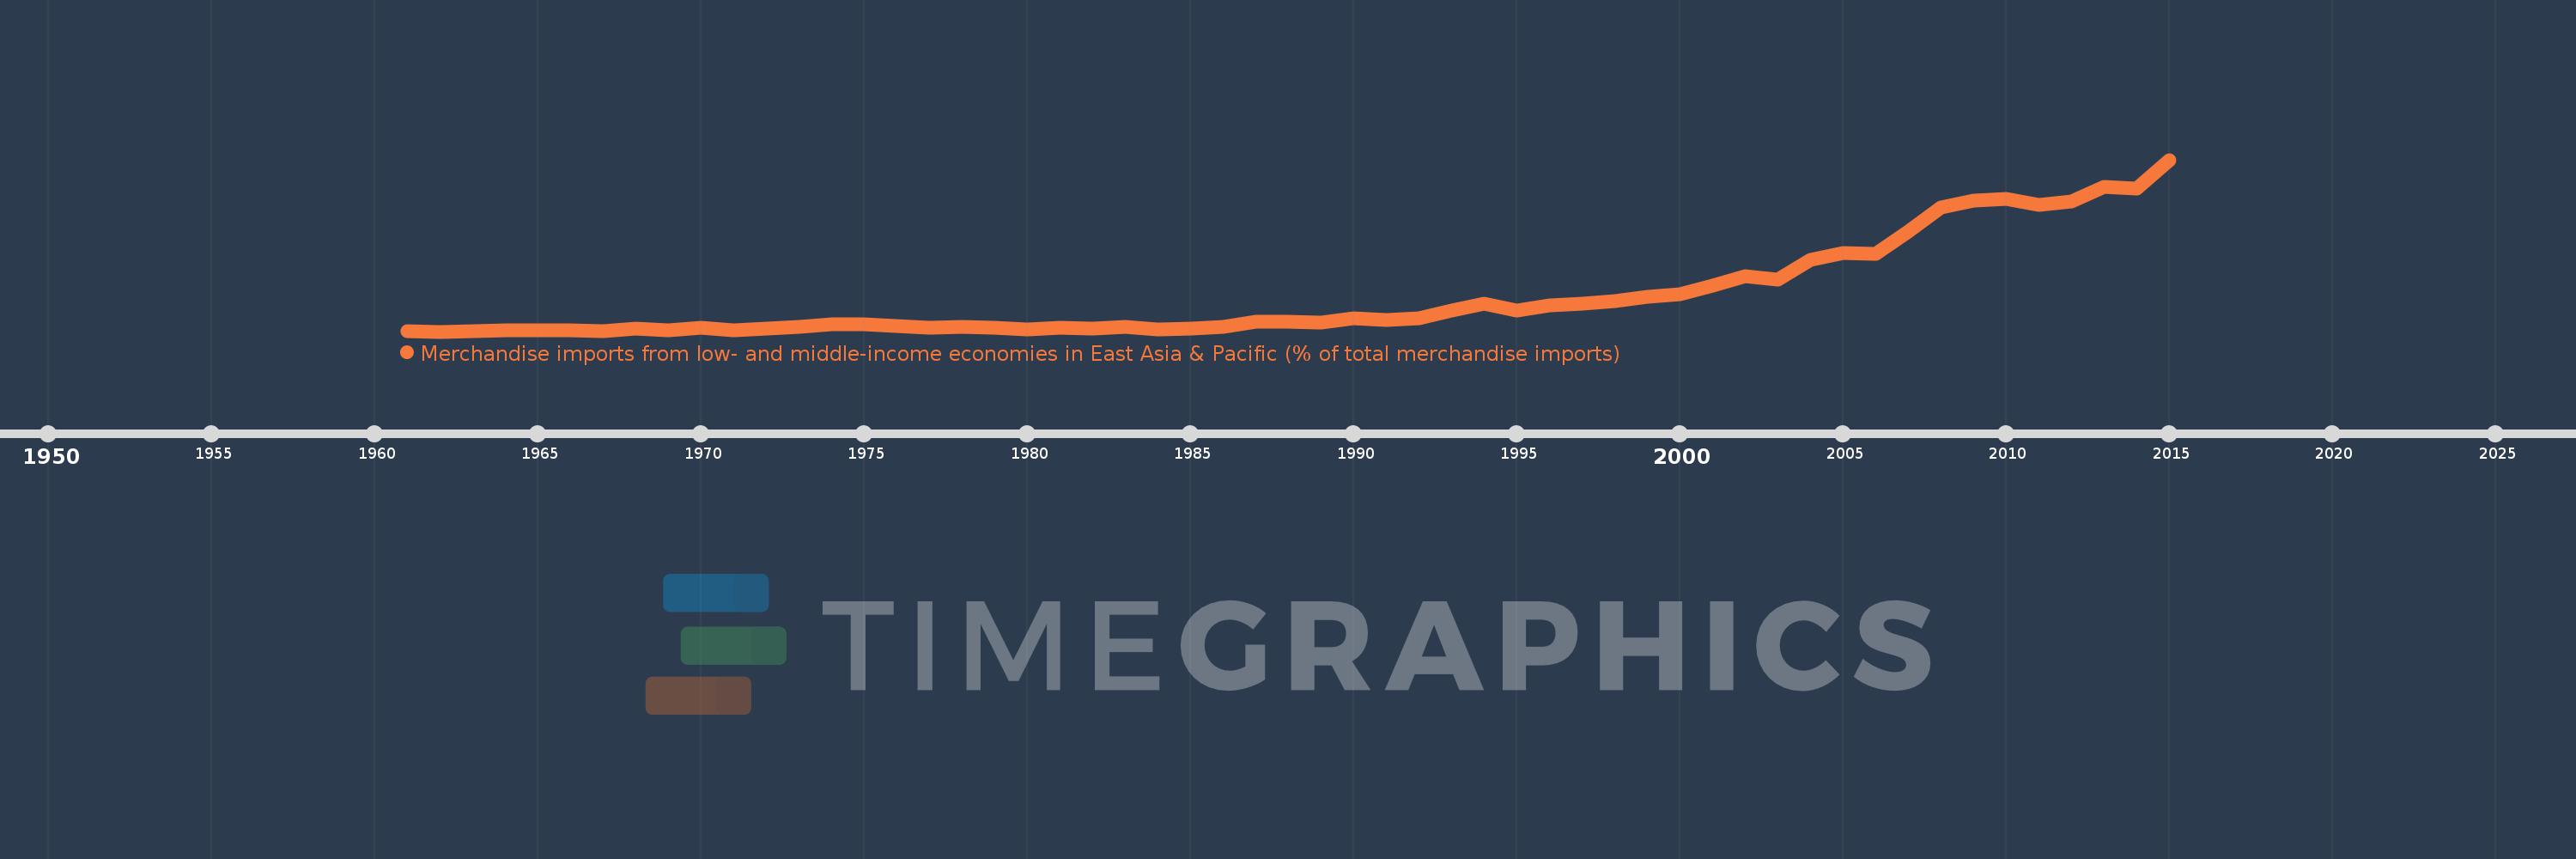
Merchandise imports from low- and middle-income economies in East Asia & Pacific (% of total merchandise imports)
2015,2014,2013,2012,2011,2010,2009,2008,2007,2006,2005,2004,2003,2002,2001,2000,1999,1998,1997,1996,1995,1994,1993,1992,1991,1990,1989,1988,1987,1986,1985,1984,1983,1982,1981,1980,1979,1978,1977,1976,1975,1974,1973,1972,1971,1970,1969,1968,1967,1966,1965,1964,1963,1962,1961
Estas estadísticas en otros países:
AfghanistanAlbaniaAlgeriaArab WorldArgentinaArmeniaArubaAustraliaAustriaAzerbaijanBahamas, TheBahrainBangladeshBarbadosBelarusBelgiumBelizeBeninBermudaBoliviaBrazilBrunei DarussalamBulgariaBurkina FasoBurundiCabo VerdeCambodiaCameroonCanadaCaribbean small statesCentral African RepublicCentral Europe and the BalticsChileChinaColombiaCongo, Rep.Costa RicaCote d'IvoireCroatiaCyprusCzech RepublicDenmarkDominicaDominican RepublicEarly-demographic dividendEast Asia & PacificEast Asia & Pacific (excluding high income)East Asia & Pacific (IDA & IBRD countries)EcuadorEgypt, Arab Rep.El SalvadorEstoniaEthiopiaEuro areaEurope & Central AsiaEurope & Central Asia (excluding high income)Europe & Central Asia (IDA & IBRD countries)European UnionFijiFinlandFragile and conflict affected situationsFranceFrench PolynesiaGabonGambia, TheGeorgiaGermanyGhanaGreeceGreenlandGrenadaGuatemalaHaitiHeavily indebted poor countries (HIPC)High incomeHondurasHong Kong SAR, ChinaHungaryIBRD onlyIcelandIDA & IBRD totalIDA blendIDA onlyIDA totalIndiaIndonesiaIran, Islamic Rep.IraqIrelandIsraelItalyJamaicaJapanJordanKazakhstanKenyaKorea, Dem. People’s Rep.Korea, Rep.KuwaitKyrgyz RepublicLao PDRLate-demographic dividendLatin America & Caribbean Latin America & Caribbean (excluding high income)Latin America & the Caribbean (IDA & IBRD countries)LatviaLeast developed countries: UN classificationLebanonLithuaniaLow & middle incomeLow incomeLower middle incomeLuxembourgMacao SAR, ChinaMacedonia, FYRMadagascarMalaysiaMaliMaltaMauritiusMexicoMiddle East & North AfricaMiddle East & North Africa (excluding high income)Middle East & North Africa (IDA & IBRD countries)Middle incomeMoldovaMongoliaMontenegroMoroccoMyanmarNetherlandsNew CaledoniaNew ZealandNicaraguaNigerNigeriaNorth AmericaNorwayOECD membersOmanOther small statesPacific island small statesPakistanPanamaPapua New GuineaParaguayPeruPhilippinesPolandPortugalPost-demographic dividendPre-demographic dividendQatarRomaniaRussian FederationSamoaSaudi ArabiaSenegalSerbiaSingaporeSlovak RepublicSloveniaSmall statesSolomon IslandsSomaliaSouth AfricaSouth AsiaSouth Asia (IDA & IBRD)SpainSri LankaSt. Kitts and NevisSt. LuciaSt. Vincent and the GrenadinesSub-Saharan Africa Sub-Saharan Africa (excluding high income)Sub-Saharan Africa (IDA & IBRD countries)SurinameSwedenSwitzerlandTanzaniaThailandTogoTongaTrinidad and TobagoTunisiaTurkeyUgandaUkraineUnited Arab EmiratesUnited KingdomUnited StatesUpper middle incomeUruguayVanuatuVenezuela, RBVietnamWorldYemen, Rep.ZambiaZimbabwe línea de tiempo (timeline):
En esta escala de tiempo se presenta un gráfico de 1961 y 2015 de Heavily indebted poor countries (HIPC). Los datos de 1960 están ausentes. El número de observaciones reales por fecha: 55.
Fuente (nombre):
Indicadores del desarrollo mundial
Fuente (organización):
World Bank staff estimates based data from International Monetary Fund's Direction of Trade database.
Categorías:
Private Sector, Trade
Se ha actualizado:
23 abr 2017 año
Los indicadores de los cambios de valor en los últimos años
Mínimo:
0.039
1 ene 1962 año
Máximo:
15.132
1 ene 2015 año
A la fecha de observación
Valor
Cambio absoluto
El cambio con respecto al valor anterior
1 ene 1961 año
0.043
+0.043
0.0%
1 ene 1962 año
0.039
-0.005
-11.1%
1 ene 1963 año
0.083
+0.045
115.75%
1 ene 1964 año
0.144
+0.061
73.44%
1 ene 1965 año
0.146
+0.002
1.04%
1 ene 1966 año
0.166
+0.02
13.6%
1 ene 1967 año
0.063
-0.103
-61.91%
1 ene 1968 año
0.27
+0.206
326.83%
1 ene 1969 año
0.153
-0.116
-43.2%
1 ene 1970 año
0.365
+0.211
138.09%
1 ene 1971 año
0.157
-0.208
-56.95%
1 ene 1972 año
0.333
+0.176
112.12%
1 ene 1973 año
0.482
+0.149
44.63%
1 ene 1974 año
0.695
+0.214
44.41%
1 ene 1975 año
0.646
-0.05
-7.18%
1 ene 1976 año
0.518
-0.127
-19.75%
1 ene 1977 año
0.405
-0.113
-21.87%
1 ene 1978 año
0.417
+0.013
3.12%
1 ene 1979 año
0.382
-0.035
-8.42%
1 ene 1980 año
0.222
-0.16
-41.94%
1 ene 1981 año
0.397
+0.176
79.12%
1 ene 1982 año
0.302
-0.095
-24.02%
1 ene 1983 año
0.432
+0.13
42.95%
1 ene 1984 año
0.258
-0.174
-40.2%
1 ene 1985 año
0.311
+0.053
20.59%
1 ene 1986 año
0.488
+0.177
56.73%
1 ene 1987 año
0.917
+0.429
87.93%
1 ene 1988 año
0.943
+0.026
2.82%
1 ene 1989 año
0.81
-0.133
-14.15%
1 ene 1990 año
1.218
+0.408
50.43%
1 ene 1991 año
1.046
-0.172
-14.11%
1 ene 1992 año
1.232
+0.186
17.74%
1 ene 1993 año
1.92
+0.688
55.87%
1 ene 1994 año
2.493
+0.573
29.87%
1 ene 1995 año
1.915
-0.578
-23.17%
1 ene 1996 año
2.303
+0.387
20.23%
1 ene 1997 año
2.476
+0.174
7.54%
1 ene 1998 año
2.718
+0.242
9.76%
1 ene 1999 año
3.114
+0.396
14.57%
1 ene 2000 año
3.334
+0.22
7.06%
1 ene 2001 año
4.06
+0.726
21.76%
1 ene 2002 año
4.894
+0.834
20.55%
1 ene 2003 año
4.576
-0.318
-6.5%
1 ene 2004 año
6.329
+1.753
38.3%
1 ene 2005 año
6.925
+0.597
9.43%
1 ene 2006 año
6.884
-0.041
-0.6%
1 ene 2007 año
8.846
+1.962
28.5%
1 ene 2008 año
10.909
+2.063
23.32%
1 ene 2009 año
11.529
+0.62
5.68%
1 ene 2010 año
11.724
+0.195
1.69%
1 ene 2011 año
11.194
-0.531
-4.52%
1 ene 2012 año
11.435
+0.241
2.16%
1 ene 2013 año
12.759
+1.323
11.57%
1 ene 2014 año
12.582
-0.176
-1.38%
1 ene 2015 año
15.132
+2.549
20.26%
Ranking de los países por los datos estadísticos actuales


Comentarios: