29
/es/
es
AIzaSyAYiBZKx7MnpbEhh9jyipgxe19OcubqV5w
April 1, 2024
50410
Middle East & North Africa (IDA & IBRD countries)
TMN
false
2
1
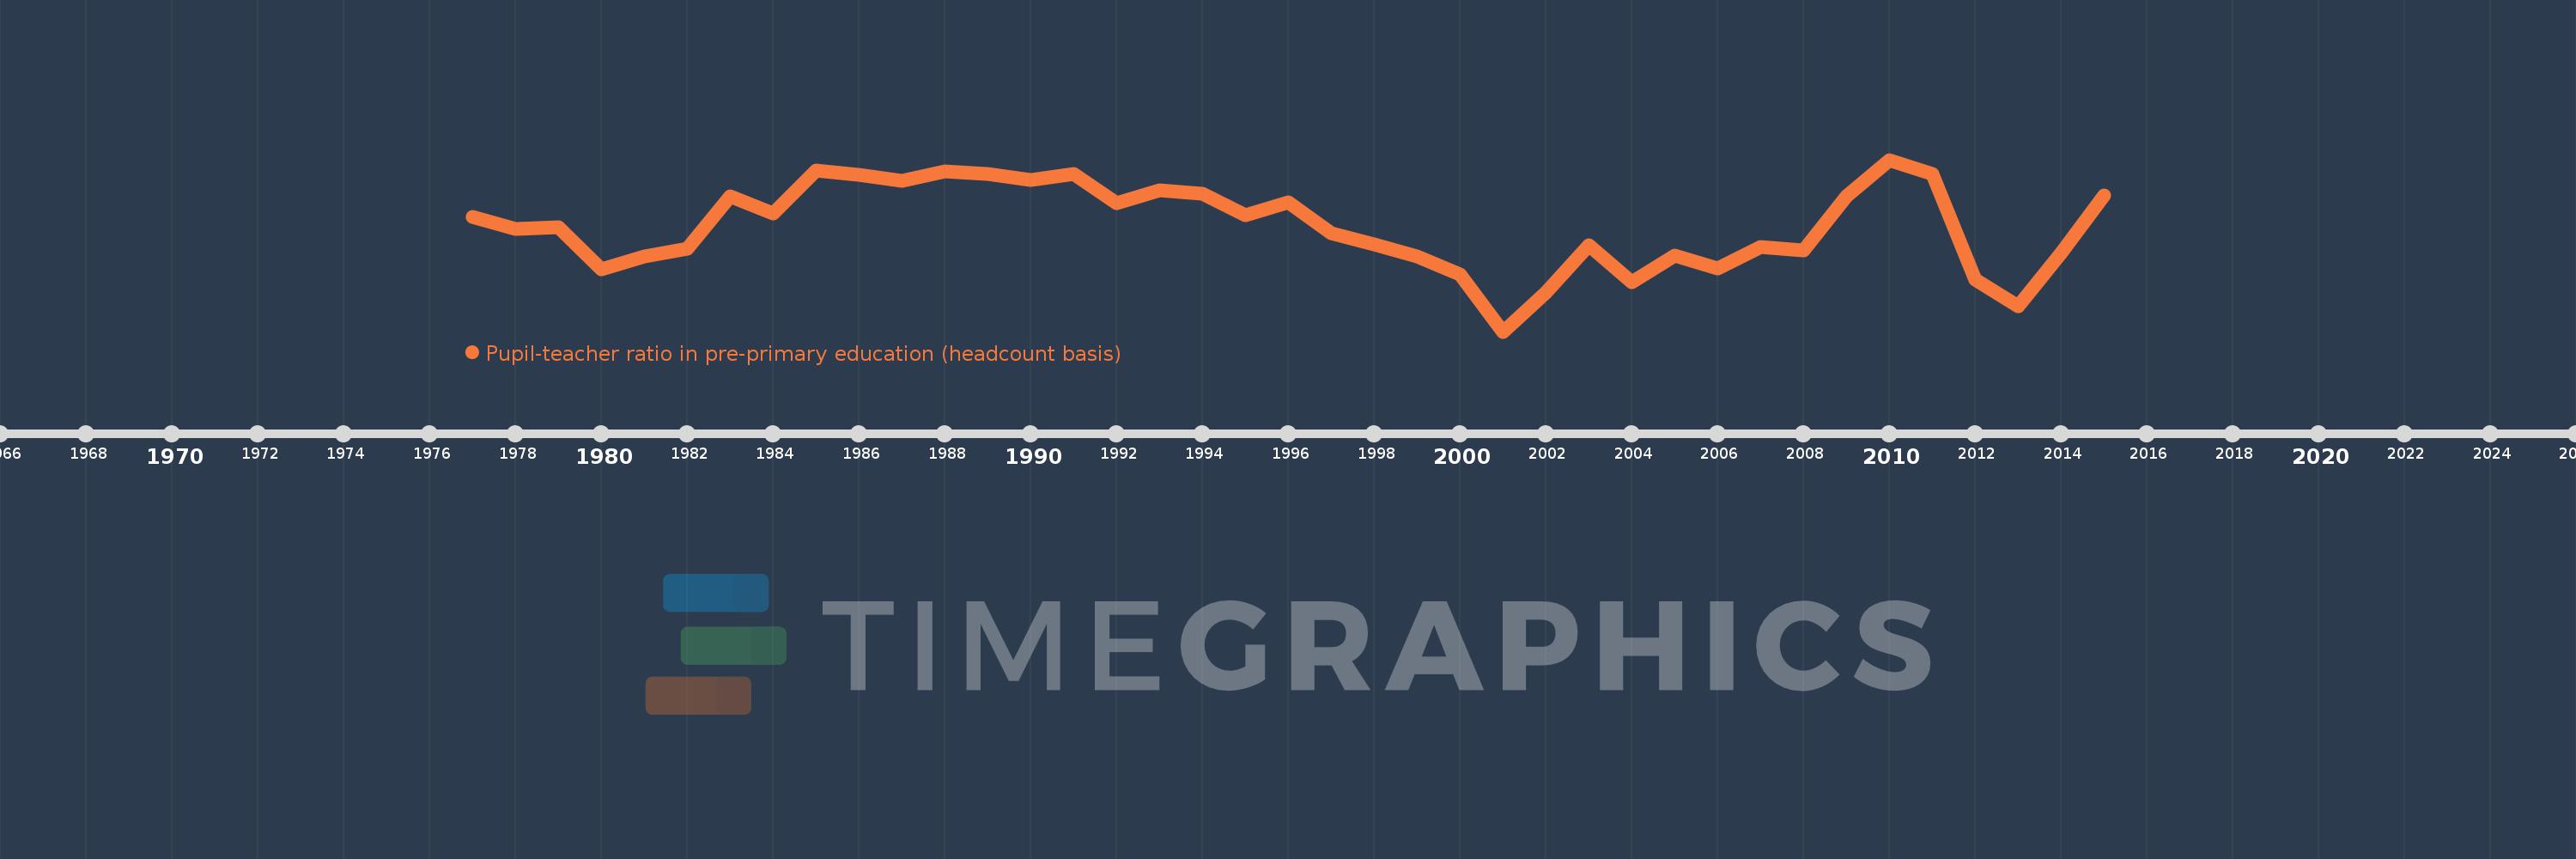
Pupil-teacher ratio in pre-primary education (headcount basis)
2015,2014,2013,2012,2011,2010,2009,2008,2007,2006,2005,2004,2003,2002,2001,2000,1999,1998,1997,1996,1995,1994,1993,1992,1991,1990,1989,1988,1987,1986,1985,1984,1983,1982,1981,1980,1979,1978,1977
Estas estadísticas en otros países:
AfghanistanAlbaniaAlgeriaAndorraAngolaAntigua and BarbudaArab WorldArgentinaArmeniaArubaAustriaAzerbaijanBahamas, TheBahrainBangladeshBarbadosBelarusBelgiumBelizeBeninBermudaBhutanBoliviaBosnia and HerzegovinaBotswanaBrazilBritish Virgin IslandsBrunei DarussalamBulgariaBurkina FasoBurundiCabo VerdeCambodiaCameroonCanadaCaribbean small statesCayman IslandsCentral African RepublicCentral Europe and the BalticsChadChileChinaColombiaComorosCongo, Dem. Rep.Congo, Rep.Costa RicaCote d'IvoireCroatiaCubaCyprusCzech RepublicDenmarkDjiboutiDominicaDominican RepublicEarly-demographic dividendEast Asia & PacificEast Asia & Pacific (excluding high income)East Asia & Pacific (IDA & IBRD countries)EcuadorEgypt, Arab Rep.El SalvadorEquatorial GuineaEritreaEstoniaEthiopiaEuro areaEurope & Central AsiaEurope & Central Asia (excluding high income)Europe & Central Asia (IDA & IBRD countries)European UnionFijiFinlandFragile and conflict affected situationsFranceGabonGambia, TheGeorgiaGermanyGhanaGibraltarGreeceGrenadaGuatemalaGuineaGuinea-BissauGuyanaHaitiHeavily indebted poor countries (HIPC)High incomeHondurasHong Kong SAR, ChinaHungaryIBRD onlyIcelandIDA & IBRD totalIDA blendIDA onlyIDA totalIndiaIndonesiaIran, Islamic Rep.IraqIrelandIsraelItalyJamaicaJapanJordanKazakhstanKenyaKorea, Dem. People’s Rep.Korea, Rep.KuwaitKyrgyz RepublicLao PDRLate-demographic dividendLatin America & Caribbean Latin America & Caribbean (excluding high income)Latin America & the Caribbean (IDA & IBRD countries)LatviaLeast developed countries: UN classificationLebanonLesothoLiberiaLibyaLiechtensteinLithuaniaLow & middle incomeLow incomeLower middle incomeLuxembourgMacao SAR, ChinaMacedonia, FYRMadagascarMalaysiaMaldivesMaliMaltaMarshall IslandsMauritaniaMauritiusMexicoMiddle East & North AfricaMiddle East & North Africa (excluding high income)Middle East & North Africa (IDA & IBRD countries)Middle incomeMoldovaMonacoMongoliaMontenegroMoroccoMozambiqueMyanmarNamibiaNauruNepalNetherlandsNew ZealandNicaraguaNigerNigeriaNorth AmericaNorwayOECD membersOmanOther small statesPacific island small statesPalauPanamaPapua New GuineaParaguayPeruPhilippinesPolandPortugalPost-demographic dividendPre-demographic dividendPuerto RicoQatarRomaniaRussian FederationRwandaSamoaSan MarinoSao Tome and PrincipeSaudi ArabiaSenegalSerbiaSeychellesSierra LeoneSingaporeSlovak RepublicSloveniaSmall statesSolomon IslandsSomaliaSouth AfricaSouth AsiaSouth Asia (IDA & IBRD)South SudanSpainSt. Kitts and NevisSt. LuciaSt. Vincent and the GrenadinesSub-Saharan Africa Sub-Saharan Africa (excluding high income)Sub-Saharan Africa (IDA & IBRD countries)SudanSurinameSwazilandSwedenSwitzerlandSyrian Arab RepublicTajikistanTanzaniaThailandTimor-LesteTogoTongaTrinidad and TobagoTunisiaTurkeyTurks and Caicos IslandsTuvaluUgandaUkraineUnited Arab EmiratesUnited KingdomUnited StatesUpper middle incomeUruguayUzbekistanVanuatuVenezuela, RBVietnamWest Bank and GazaWorldYemen, Rep.Zimbabwe línea de tiempo (timeline):
En esta escala de tiempo se presenta un gráfico de 1977 y 2015 de Middle East & North Africa (IDA & IBRD countries). Los datos de 1976 están ausentes. El número de observaciones reales por fecha: 39.
Fuente (nombre):
Indicadores del desarrollo mundial
Fuente (organización):
UNESCO Institute for Statistics
Categorías:
Education
Se ha actualizado:
23 abr 2017 año
Los indicadores de los cambios de valor en los últimos años
Mínimo:
18.838
1 ene 2001 año
Máximo:
22.694
1 ene 2010 año
A la fecha de observación
Valor
Cambio absoluto
El cambio con respecto al valor anterior
1 ene 1977 año
21.418
+21.418
0.0%
1 ene 1978 año
21.14
-0.278
-1.3%
1 ene 1979 año
21.171
+0.031
0.15%
1 ene 1980 año
20.236
-0.935
-4.42%
1 ene 1981 año
20.531
+0.295
1.46%
1 ene 1982 año
20.697
+0.166
0.81%
1 ene 1983 año
21.867
+1.17
5.65%
1 ene 1984 año
21.489
-0.378
-1.73%
1 ene 1985 año
22.452
+0.963
4.48%
1 ene 1986 año
22.363
-0.089
-0.4%
1 ene 1987 año
22.227
-0.136
-0.61%
1 ene 1988 año
22.425
+0.198
0.89%
1 ene 1989 año
22.378
-0.047
-0.21%
1 ene 1990 año
22.241
-0.137
-0.61%
1 ene 1991 año
22.368
+0.127
0.57%
1 ene 1992 año
21.717
-0.651
-2.91%
1 ene 1993 año
22.009
+0.292
1.34%
1 ene 1994 año
21.934
-0.075
-0.34%
1 ene 1995 año
21.444
-0.49
-2.23%
1 ene 1996 año
21.745
+0.301
1.41%
1 ene 1997 año
21.042
-0.703
-3.23%
1 ene 1998 año
20.788
-0.254
-1.21%
1 ene 1999 año
20.528
-0.26
-1.25%
1 ene 2000 año
20.129
-0.398
-1.94%
1 ene 2001 año
18.838
-1.292
-6.42%
1 ene 2002 año
19.724
+0.886
4.71%
1 ene 2003 año
20.777
+1.053
5.34%
1 ene 2004 año
19.956
-0.822
-3.95%
1 ene 2005 año
20.547
+0.591
2.96%
1 ene 2006 año
20.263
-0.283
-1.38%
1 ene 2007 año
20.739
+0.476
2.35%
1 ene 2008 año
20.657
-0.082
-0.39%
1 ene 2009 año
21.868
+1.211
5.86%
1 ene 2010 año
22.694
+0.826
3.78%
1 ene 2011 año
22.384
-0.31
-1.36%
1 ene 2012 año
20.008
-2.376
-10.61%
1 ene 2013 año
19.406
-0.602
-3.01%
1 ene 2014 año
20.599
+1.193
6.15%
1 ene 2015 año
21.902
+1.303
6.33%
Ranking de los países por los datos estadísticos actuales


Comentarios: