29
/es/
es
AIzaSyAYiBZKx7MnpbEhh9jyipgxe19OcubqV5w
April 1, 2024
199796
Mongolia
MNG
true
2
1
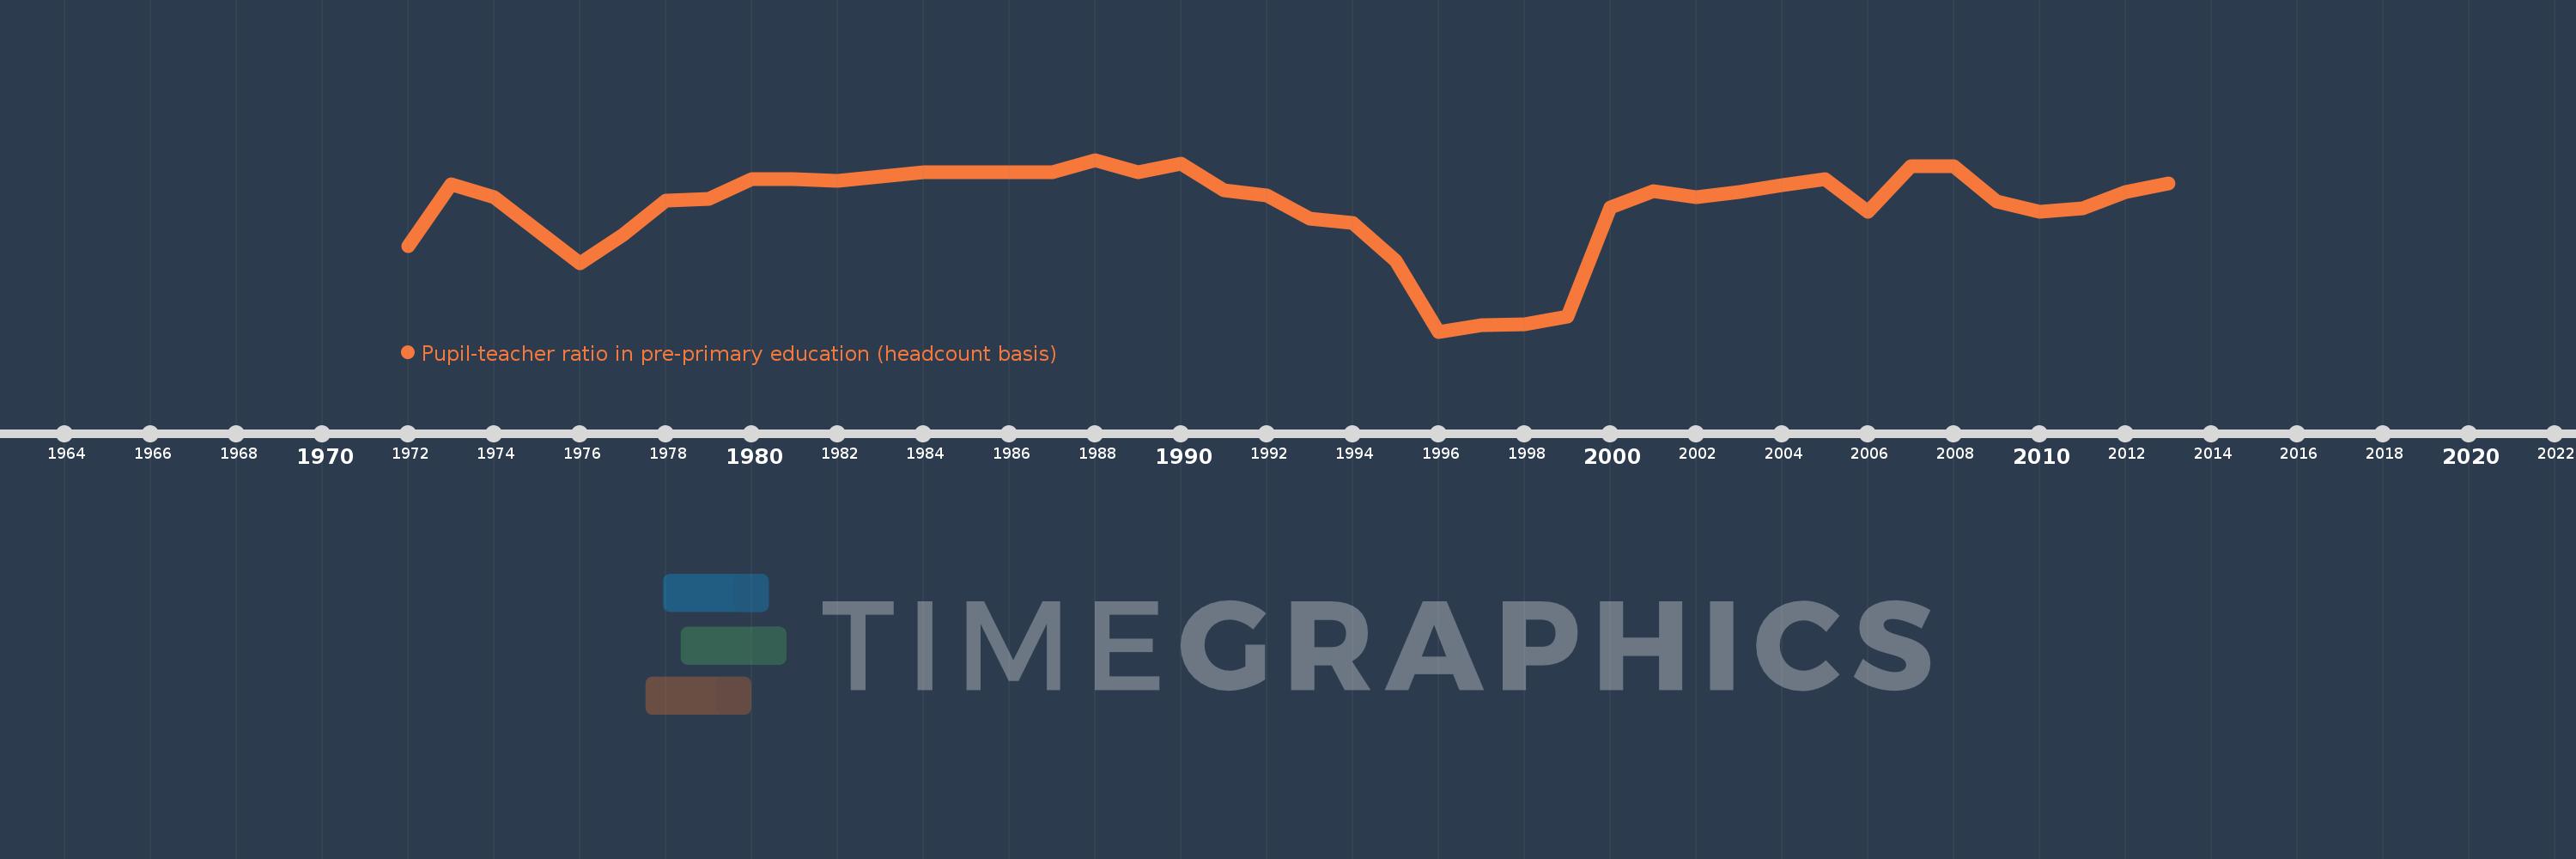
Pupil-teacher ratio in pre-primary education (headcount basis)
2013,2012,2011,2010,2009,2008,2007,2006,2005,2004,2003,2002,2001,2000,1999,1998,1997,1996,1995,1994,1993,1992,1991,1990,1989,1988,1987,1984,1982,1981,1980,1979,1978,1977,1976,1974,1973,1972
Estas estadísticas en otros países:
AfghanistanAlbaniaAlgeriaAndorraAngolaAntigua and BarbudaArab WorldArgentinaArmeniaArubaAustriaAzerbaijanBahamas, TheBahrainBangladeshBarbadosBelarusBelgiumBelizeBeninBermudaBhutanBoliviaBosnia and HerzegovinaBotswanaBrazilBritish Virgin IslandsBrunei DarussalamBulgariaBurkina FasoBurundiCabo VerdeCambodiaCameroonCanadaCaribbean small statesCayman IslandsCentral African RepublicCentral Europe and the BalticsChadChileChinaColombiaComorosCongo, Dem. Rep.Congo, Rep.Costa RicaCote d'IvoireCroatiaCubaCyprusCzech RepublicDenmarkDjiboutiDominicaDominican RepublicEarly-demographic dividendEast Asia & PacificEast Asia & Pacific (excluding high income)East Asia & Pacific (IDA & IBRD countries)EcuadorEgypt, Arab Rep.El SalvadorEquatorial GuineaEritreaEstoniaEthiopiaEuro areaEurope & Central AsiaEurope & Central Asia (excluding high income)Europe & Central Asia (IDA & IBRD countries)European UnionFijiFinlandFragile and conflict affected situationsFranceGabonGambia, TheGeorgiaGermanyGhanaGibraltarGreeceGrenadaGuatemalaGuineaGuinea-BissauGuyanaHaitiHeavily indebted poor countries (HIPC)High incomeHondurasHong Kong SAR, ChinaHungaryIBRD onlyIcelandIDA & IBRD totalIDA blendIDA onlyIDA totalIndiaIndonesiaIran, Islamic Rep.IraqIrelandIsraelItalyJamaicaJapanJordanKazakhstanKenyaKorea, Dem. People’s Rep.Korea, Rep.KuwaitKyrgyz RepublicLao PDRLate-demographic dividendLatin America & Caribbean Latin America & Caribbean (excluding high income)Latin America & the Caribbean (IDA & IBRD countries)LatviaLeast developed countries: UN classificationLebanonLesothoLiberiaLibyaLiechtensteinLithuaniaLow & middle incomeLow incomeLower middle incomeLuxembourgMacao SAR, ChinaMacedonia, FYRMadagascarMalaysiaMaldivesMaliMaltaMarshall IslandsMauritaniaMauritiusMexicoMiddle East & North AfricaMiddle East & North Africa (excluding high income)Middle East & North Africa (IDA & IBRD countries)Middle incomeMoldovaMonacoMongoliaMontenegroMoroccoMozambiqueMyanmarNamibiaNauruNepalNetherlandsNew ZealandNicaraguaNigerNigeriaNorth AmericaNorwayOECD membersOmanOther small statesPacific island small statesPalauPanamaPapua New GuineaParaguayPeruPhilippinesPolandPortugalPost-demographic dividendPre-demographic dividendPuerto RicoQatarRomaniaRussian FederationRwandaSamoaSan MarinoSao Tome and PrincipeSaudi ArabiaSenegalSerbiaSeychellesSierra LeoneSingaporeSlovak RepublicSloveniaSmall statesSolomon IslandsSomaliaSouth AfricaSouth AsiaSouth Asia (IDA & IBRD)South SudanSpainSt. Kitts and NevisSt. LuciaSt. Vincent and the GrenadinesSub-Saharan Africa Sub-Saharan Africa (excluding high income)Sub-Saharan Africa (IDA & IBRD countries)SudanSurinameSwazilandSwedenSwitzerlandSyrian Arab RepublicTajikistanTanzaniaThailandTimor-LesteTogoTongaTrinidad and TobagoTunisiaTurkeyTurks and Caicos IslandsTuvaluUgandaUkraineUnited Arab EmiratesUnited KingdomUnited StatesUpper middle incomeUruguayUzbekistanVanuatuVenezuela, RBVietnamWest Bank and GazaWorldYemen, Rep.Zimbabwe línea de tiempo (timeline):
En esta escala de tiempo se presenta un gráfico de 1972 y 2013 de Mongolia. Los datos de 1971 están ausentes. El número de observaciones reales por fecha: 38.
Fuente (nombre):
Indicadores del desarrollo mundial
Fuente (organización):
UNESCO Institute for Statistics
Categorías:
Education
Se ha actualizado:
23 abr 2017 año
Los indicadores de los cambios de valor en los últimos años
Mínimo:
11.482
1 ene 1996 año
Máximo:
29.692
1 ene 1988 año
A la fecha de observación
Valor
Cambio absoluto
El cambio con respecto al valor anterior
1 ene 1972 año
20.565
+20.565
0.0%
1 ene 1973 año
27.122
+6.558
31.89%
1 ene 1974 año
25.765
-1.357
-5.0%
1 ene 1976 año
18.691
-7.075
-27.46%
1 ene 1977 año
21.762
+3.071
16.43%
1 ene 1978 año
25.408
+3.646
16.75%
1 ene 1979 año
25.559
+0.152
0.6%
1 ene 1980 año
27.667
+2.107
8.25%
1 ene 1981 año
27.605
-0.062
-0.22%
1 ene 1982 año
27.472
-0.133
-0.48%
1 ene 1984 año
28.342
+0.869
3.16%
1 ene 1987 año
28.331
-0.011
-0.04%
1 ene 1988 año
29.692
+1.361
4.8%
1 ene 1989 año
28.374
-1.318
-4.44%
1 ene 1990 año
29.284
+0.91
3.21%
1 ene 1991 año
26.477
-2.807
-9.59%
1 ene 1992 año
25.944
-0.533
-2.01%
1 ene 1993 año
23.414
-2.53
-9.75%
1 ene 1994 año
22.956
-0.458
-1.96%
1 ene 1995 año
18.995
-3.961
-17.26%
1 ene 1996 año
11.482
-7.512
-39.55%
1 ene 1997 año
12.151
+0.669
5.83%
1 ene 1998 año
12.267
+0.116
0.95%
1 ene 1999 año
13.088
+0.821
6.69%
1 ene 2000 año
24.627
+11.539
88.16%
1 ene 2001 año
26.333
+1.706
6.93%
1 ene 2002 año
25.703
-0.63
-2.39%
1 ene 2003 año
26.307
+0.604
2.35%
1 ene 2004 año
26.963
+0.656
2.49%
1 ene 2005 año
27.614
+0.651
2.41%
1 ene 2006 año
24.145
-3.469
-12.56%
1 ene 2007 año
29.019
+4.874
20.19%
1 ene 2008 año
29.032
+0.013
0.04%
1 ene 2009 año
25.277
-3.755
-12.94%
1 ene 2010 año
24.168
-1.108
-4.38%
1 ene 2011 año
24.519
+0.351
1.45%
1 ene 2012 año
26.253
+1.734
7.07%
1 ene 2013 año
27.176
+0.922
3.51%
Ranking de los países por los datos estadísticos actuales


Comentarios: