29
/es/
es
AIzaSyAYiBZKx7MnpbEhh9jyipgxe19OcubqV5w
April 1, 2024
196212
Mexico
MEX
true
2
1
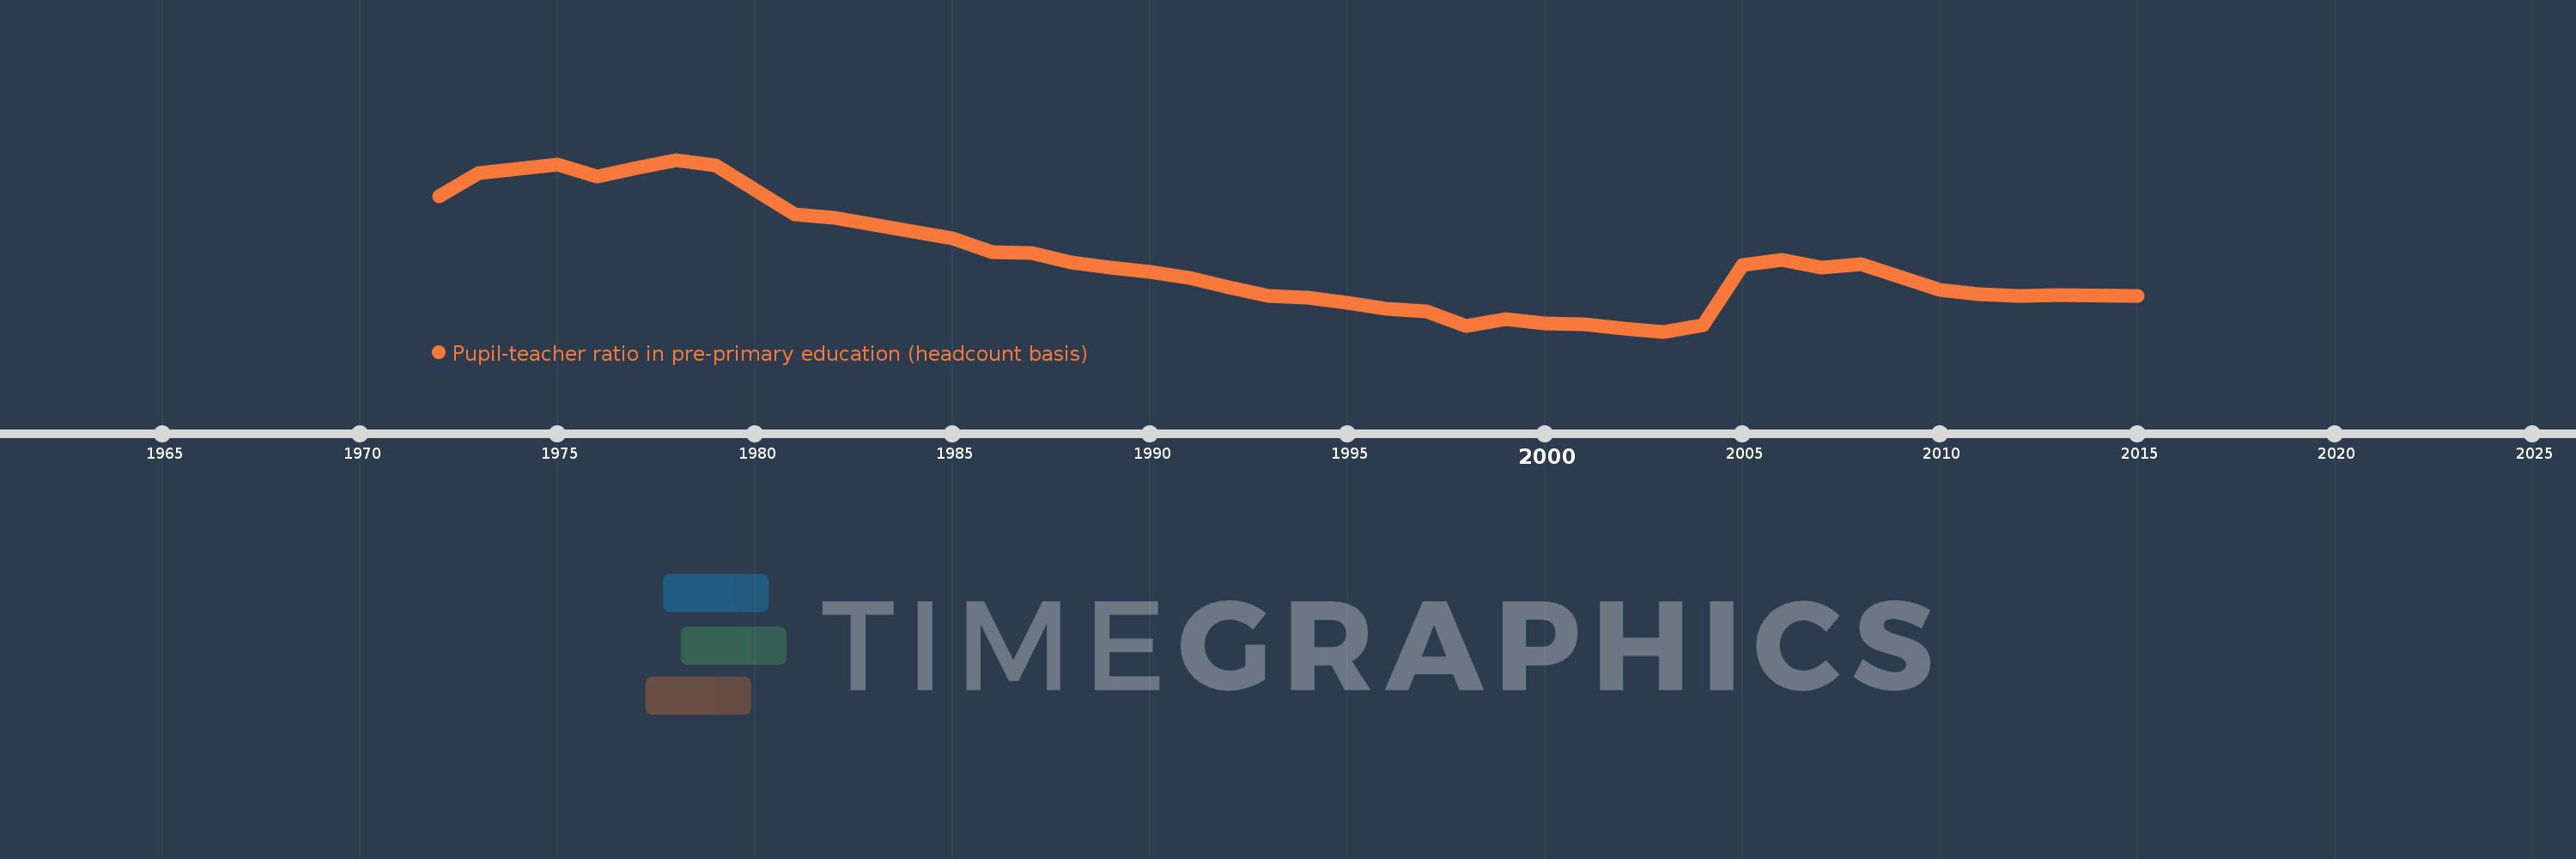
Pupil-teacher ratio in pre-primary education (headcount basis)
2015,2013,2012,2011,2010,2009,2008,2007,2006,2005,2004,2003,2002,2001,2000,1999,1998,1997,1996,1995,1994,1993,1992,1991,1990,1989,1988,1987,1986,1985,1984,1983,1982,1981,1979,1978,1977,1976,1975,1973,1972
Estas estadísticas en otros países:
AfghanistanAlbaniaAlgeriaAndorraAngolaAntigua and BarbudaArab WorldArgentinaArmeniaArubaAustriaAzerbaijanBahamas, TheBahrainBangladeshBarbadosBelarusBelgiumBelizeBeninBermudaBhutanBoliviaBosnia and HerzegovinaBotswanaBrazilBritish Virgin IslandsBrunei DarussalamBulgariaBurkina FasoBurundiCabo VerdeCambodiaCameroonCanadaCaribbean small statesCayman IslandsCentral African RepublicCentral Europe and the BalticsChadChileChinaColombiaComorosCongo, Dem. Rep.Congo, Rep.Costa RicaCote d'IvoireCroatiaCubaCyprusCzech RepublicDenmarkDjiboutiDominicaDominican RepublicEarly-demographic dividendEast Asia & PacificEast Asia & Pacific (excluding high income)East Asia & Pacific (IDA & IBRD countries)EcuadorEgypt, Arab Rep.El SalvadorEquatorial GuineaEritreaEstoniaEthiopiaEuro areaEurope & Central AsiaEurope & Central Asia (excluding high income)Europe & Central Asia (IDA & IBRD countries)European UnionFijiFinlandFragile and conflict affected situationsFranceGabonGambia, TheGeorgiaGermanyGhanaGibraltarGreeceGrenadaGuatemalaGuineaGuinea-BissauGuyanaHaitiHeavily indebted poor countries (HIPC)High incomeHondurasHong Kong SAR, ChinaHungaryIBRD onlyIcelandIDA & IBRD totalIDA blendIDA onlyIDA totalIndiaIndonesiaIran, Islamic Rep.IraqIrelandIsraelItalyJamaicaJapanJordanKazakhstanKenyaKorea, Dem. People’s Rep.Korea, Rep.KuwaitKyrgyz RepublicLao PDRLate-demographic dividendLatin America & Caribbean Latin America & Caribbean (excluding high income)Latin America & the Caribbean (IDA & IBRD countries)LatviaLeast developed countries: UN classificationLebanonLesothoLiberiaLibyaLiechtensteinLithuaniaLow & middle incomeLow incomeLower middle incomeLuxembourgMacao SAR, ChinaMacedonia, FYRMadagascarMalaysiaMaldivesMaliMaltaMarshall IslandsMauritaniaMauritiusMexicoMiddle East & North AfricaMiddle East & North Africa (excluding high income)Middle East & North Africa (IDA & IBRD countries)Middle incomeMoldovaMonacoMongoliaMontenegroMoroccoMozambiqueMyanmarNamibiaNauruNepalNetherlandsNew ZealandNicaraguaNigerNigeriaNorth AmericaNorwayOECD membersOmanOther small statesPacific island small statesPalauPanamaPapua New GuineaParaguayPeruPhilippinesPolandPortugalPost-demographic dividendPre-demographic dividendPuerto RicoQatarRomaniaRussian FederationRwandaSamoaSan MarinoSao Tome and PrincipeSaudi ArabiaSenegalSerbiaSeychellesSierra LeoneSingaporeSlovak RepublicSloveniaSmall statesSolomon IslandsSomaliaSouth AfricaSouth AsiaSouth Asia (IDA & IBRD)South SudanSpainSt. Kitts and NevisSt. LuciaSt. Vincent and the GrenadinesSub-Saharan Africa Sub-Saharan Africa (excluding high income)Sub-Saharan Africa (IDA & IBRD countries)SudanSurinameSwazilandSwedenSwitzerlandSyrian Arab RepublicTajikistanTanzaniaThailandTimor-LesteTogoTongaTrinidad and TobagoTunisiaTurkeyTurks and Caicos IslandsTuvaluUgandaUkraineUnited Arab EmiratesUnited KingdomUnited StatesUpper middle incomeUruguayUzbekistanVanuatuVenezuela, RBVietnamWest Bank and GazaWorldYemen, Rep.Zimbabwe línea de tiempo (timeline):
En esta escala de tiempo se presenta un gráfico de 1972 y 2015 de Mexico. Los datos de 1971 están ausentes. El número de observaciones reales por fecha: 41.
Fuente (nombre):
Indicadores del desarrollo mundial
Fuente (organización):
UNESCO Institute for Statistics
Categorías:
Education
Se ha actualizado:
23 abr 2017 año
Los indicadores de los cambios de valor en los últimos años
Mínimo:
21.586
1 ene 2003 año
Máximo:
39.025
1 ene 1978 año
A la fecha de observación
Valor
Cambio absoluto
El cambio con respecto al valor anterior
1 ene 1972 año
35.318
+35.318
0.0%
1 ene 1973 año
37.666
+2.349
6.65%
1 ene 1975 año
38.502
+0.836
2.22%
1 ene 1976 año
37.283
-1.219
-3.17%
1 ene 1977 año
38.165
+0.882
2.37%
1 ene 1978 año
39.025
+0.861
2.26%
1 ene 1979 año
38.445
-0.58
-1.49%
1 ene 1981 año
33.475
-4.97
-12.93%
1 ene 1982 año
33.107
-0.368
-1.1%
1 ene 1983 año
32.421
-0.686
-2.07%
1 ene 1984 año
31.746
-0.675
-2.08%
1 ene 1985 año
31.075
-0.671
-2.11%
1 ene 1986 año
29.692
-1.383
-4.45%
1 ene 1987 año
29.572
-0.12
-0.4%
1 ene 1988 año
28.626
-0.946
-3.2%
1 ene 1989 año
28.105
-0.521
-1.82%
1 ene 1990 año
27.639
-0.465
-1.66%
1 ene 1991 año
27.026
-0.614
-2.22%
1 ene 1992 año
26.046
-0.98
-3.63%
1 ene 1993 año
25.202
-0.844
-3.24%
1 ene 1994 año
25.004
-0.197
-0.78%
1 ene 1995 año
24.509
-0.496
-1.98%
1 ene 1996 año
23.869
-0.64
-2.61%
1 ene 1997 año
23.62
-0.248
-1.04%
1 ene 1998 año
22.143
-1.477
-6.26%
1 ene 1999 año
22.838
+0.695
3.14%
1 ene 2000 año
22.394
-0.444
-1.94%
1 ene 2001 año
22.358
-0.036
-0.16%
1 ene 2002 año
21.903
-0.455
-2.03%
1 ene 2003 año
21.586
-0.316
-1.44%
1 ene 2004 año
22.268
+0.681
3.16%
1 ene 2005 año
28.31
+6.042
27.13%
1 ene 2006 año
28.876
+0.566
2.0%
1 ene 2007 año
28.092
-0.784
-2.72%
1 ene 2008 año
28.392
+0.301
1.07%
1 ene 2009 año
27.08
-1.312
-4.62%
1 ene 2010 año
25.852
-1.228
-4.54%
1 ene 2011 año
25.373
-0.479
-1.85%
1 ene 2012 año
25.209
-0.164
-0.65%
1 ene 2013 año
25.256
+0.047
0.19%
1 ene 2015 año
25.18
-0.076
-0.3%
Ranking de los países por los datos estadísticos actuales


Comentarios: