29
/es/
es
AIzaSyAYiBZKx7MnpbEhh9jyipgxe19OcubqV5w
April 1, 2024
43829
Latin America & the Caribbean (IDA & IBRD countries)
TLA
false
2
1
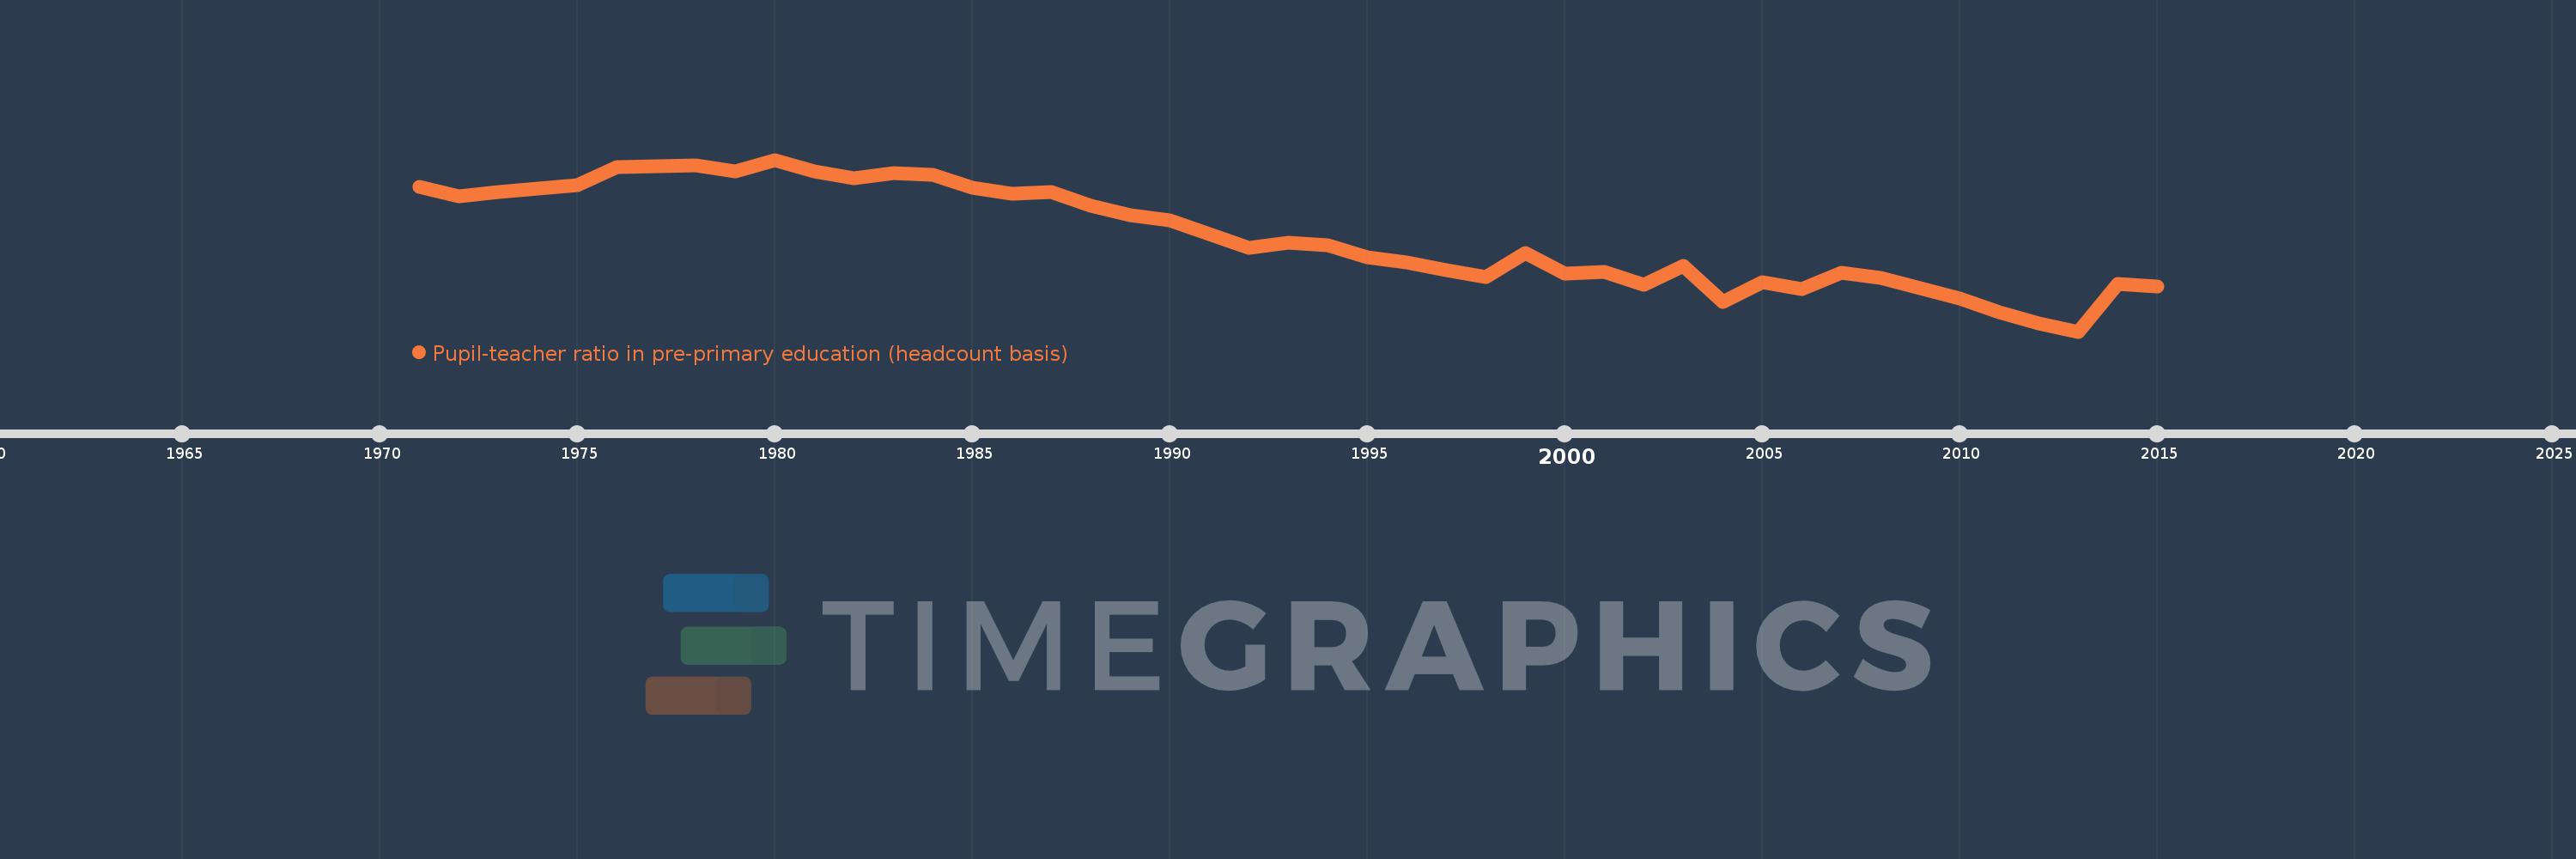
Pupil-teacher ratio in pre-primary education (headcount basis)
2015,2014,2013,2012,2011,2010,2009,2008,2007,2006,2005,2004,2003,2002,2001,2000,1999,1998,1997,1996,1995,1994,1993,1992,1991,1990,1989,1988,1987,1986,1985,1984,1983,1982,1981,1980,1979,1978,1977,1976,1975,1974,1973,1972,1971
Estas estadísticas en otros países:
AfghanistanAlbaniaAlgeriaAndorraAngolaAntigua and BarbudaArab WorldArgentinaArmeniaArubaAustriaAzerbaijanBahamas, TheBahrainBangladeshBarbadosBelarusBelgiumBelizeBeninBermudaBhutanBoliviaBosnia and HerzegovinaBotswanaBrazilBritish Virgin IslandsBrunei DarussalamBulgariaBurkina FasoBurundiCabo VerdeCambodiaCameroonCanadaCaribbean small statesCayman IslandsCentral African RepublicCentral Europe and the BalticsChadChileChinaColombiaComorosCongo, Dem. Rep.Congo, Rep.Costa RicaCote d'IvoireCroatiaCubaCyprusCzech RepublicDenmarkDjiboutiDominicaDominican RepublicEarly-demographic dividendEast Asia & PacificEast Asia & Pacific (excluding high income)East Asia & Pacific (IDA & IBRD countries)EcuadorEgypt, Arab Rep.El SalvadorEquatorial GuineaEritreaEstoniaEthiopiaEuro areaEurope & Central AsiaEurope & Central Asia (excluding high income)Europe & Central Asia (IDA & IBRD countries)European UnionFijiFinlandFragile and conflict affected situationsFranceGabonGambia, TheGeorgiaGermanyGhanaGibraltarGreeceGrenadaGuatemalaGuineaGuinea-BissauGuyanaHaitiHeavily indebted poor countries (HIPC)High incomeHondurasHong Kong SAR, ChinaHungaryIBRD onlyIcelandIDA & IBRD totalIDA blendIDA onlyIDA totalIndiaIndonesiaIran, Islamic Rep.IraqIrelandIsraelItalyJamaicaJapanJordanKazakhstanKenyaKorea, Dem. People’s Rep.Korea, Rep.KuwaitKyrgyz RepublicLao PDRLate-demographic dividendLatin America & Caribbean Latin America & Caribbean (excluding high income)Latin America & the Caribbean (IDA & IBRD countries)LatviaLeast developed countries: UN classificationLebanonLesothoLiberiaLibyaLiechtensteinLithuaniaLow & middle incomeLow incomeLower middle incomeLuxembourgMacao SAR, ChinaMacedonia, FYRMadagascarMalaysiaMaldivesMaliMaltaMarshall IslandsMauritaniaMauritiusMexicoMiddle East & North AfricaMiddle East & North Africa (excluding high income)Middle East & North Africa (IDA & IBRD countries)Middle incomeMoldovaMonacoMongoliaMontenegroMoroccoMozambiqueMyanmarNamibiaNauruNepalNetherlandsNew ZealandNicaraguaNigerNigeriaNorth AmericaNorwayOECD membersOmanOther small statesPacific island small statesPalauPanamaPapua New GuineaParaguayPeruPhilippinesPolandPortugalPost-demographic dividendPre-demographic dividendPuerto RicoQatarRomaniaRussian FederationRwandaSamoaSan MarinoSao Tome and PrincipeSaudi ArabiaSenegalSerbiaSeychellesSierra LeoneSingaporeSlovak RepublicSloveniaSmall statesSolomon IslandsSomaliaSouth AfricaSouth AsiaSouth Asia (IDA & IBRD)South SudanSpainSt. Kitts and NevisSt. LuciaSt. Vincent and the GrenadinesSub-Saharan Africa Sub-Saharan Africa (excluding high income)Sub-Saharan Africa (IDA & IBRD countries)SudanSurinameSwazilandSwedenSwitzerlandSyrian Arab RepublicTajikistanTanzaniaThailandTimor-LesteTogoTongaTrinidad and TobagoTunisiaTurkeyTurks and Caicos IslandsTuvaluUgandaUkraineUnited Arab EmiratesUnited KingdomUnited StatesUpper middle incomeUruguayUzbekistanVanuatuVenezuela, RBVietnamWest Bank and GazaWorldYemen, Rep.Zimbabwe línea de tiempo (timeline):
En esta escala de tiempo se presenta un gráfico de 1971 y 2015 de Latin America & the Caribbean (IDA & IBRD countries). Los datos de 1970 están ausentes. El número de observaciones reales por fecha: 45.
Fuente (nombre):
Indicadores del desarrollo mundial
Fuente (organización):
UNESCO Institute for Statistics
Categorías:
Education
Se ha actualizado:
23 abr 2017 año
Los indicadores de los cambios de valor en los últimos años
Mínimo:
16.844
1 ene 2013 año
Máximo:
27.856
1 ene 1980 año
A la fecha de observación
Valor
Cambio absoluto
El cambio con respecto al valor anterior
1 ene 1971 año
26.135
+26.135
0.0%
1 ene 1972 año
25.525
-0.61
-2.33%
1 ene 1973 año
25.791
+0.266
1.04%
1 ene 1974 año
25.993
+0.202
0.78%
1 ene 1975 año
26.227
+0.235
0.9%
1 ene 1976 año
27.415
+1.188
4.53%
1 ene 1977 año
27.418
+0.003
0.01%
1 ene 1978 año
27.488
+0.07
0.25%
1 ene 1979 año
27.133
-0.355
-1.29%
1 ene 1980 año
27.856
+0.723
2.66%
1 ene 1981 año
27.117
-0.738
-2.65%
1 ene 1982 año
26.656
-0.462
-1.7%
1 ene 1983 año
26.98
+0.325
1.22%
1 ene 1984 año
26.875
-0.105
-0.39%
1 ene 1985 año
26.06
-0.815
-3.03%
1 ene 1986 año
25.683
-0.377
-1.45%
1 ene 1987 año
25.808
+0.125
0.49%
1 ene 1988 año
24.905
-0.903
-3.5%
1 ene 1989 año
24.318
-0.586
-2.35%
1 ene 1990 año
23.974
-0.344
-1.41%
1 ene 1991 año
23.07
-0.904
-3.77%
1 ene 1992 año
22.205
-0.865
-3.75%
1 ene 1993 año
22.534
+0.329
1.48%
1 ene 1994 año
22.351
-0.183
-0.81%
1 ene 1995 año
21.592
-0.759
-3.4%
1 ene 1996 año
21.275
-0.317
-1.47%
1 ene 1997 año
20.769
-0.506
-2.38%
1 ene 1998 año
20.314
-0.455
-2.19%
1 ene 1999 año
21.891
+1.577
7.76%
1 ene 2000 año
20.539
-1.352
-6.18%
1 ene 2001 año
20.685
+0.146
0.71%
1 ene 2002 año
19.833
-0.853
-4.12%
1 ene 2003 año
21.045
+1.212
6.11%
1 ene 2004 año
18.76
-2.285
-10.86%
1 ene 2005 año
20.008
+1.248
6.65%
1 ene 2006 año
19.552
-0.456
-2.28%
1 ene 2007 año
20.64
+1.088
5.56%
1 ene 2008 año
20.272
-0.368
-1.78%
1 ene 2009 año
19.647
-0.625
-3.08%
1 ene 2010 año
18.955
-0.691
-3.52%
1 ene 2011 año
18.073
-0.883
-4.66%
1 ene 2012 año
17.37
-0.703
-3.89%
1 ene 2013 año
16.844
-0.526
-3.03%
1 ene 2014 año
19.926
+3.082
18.3%
1 ene 2015 año
19.731
-0.195
-0.98%
Ranking de los países por los datos estadísticos actuales


Comentarios: