29
/es/
es
AIzaSyAYiBZKx7MnpbEhh9jyipgxe19OcubqV5w
April 1, 2024
46657
Low income
LIC
false
2
1
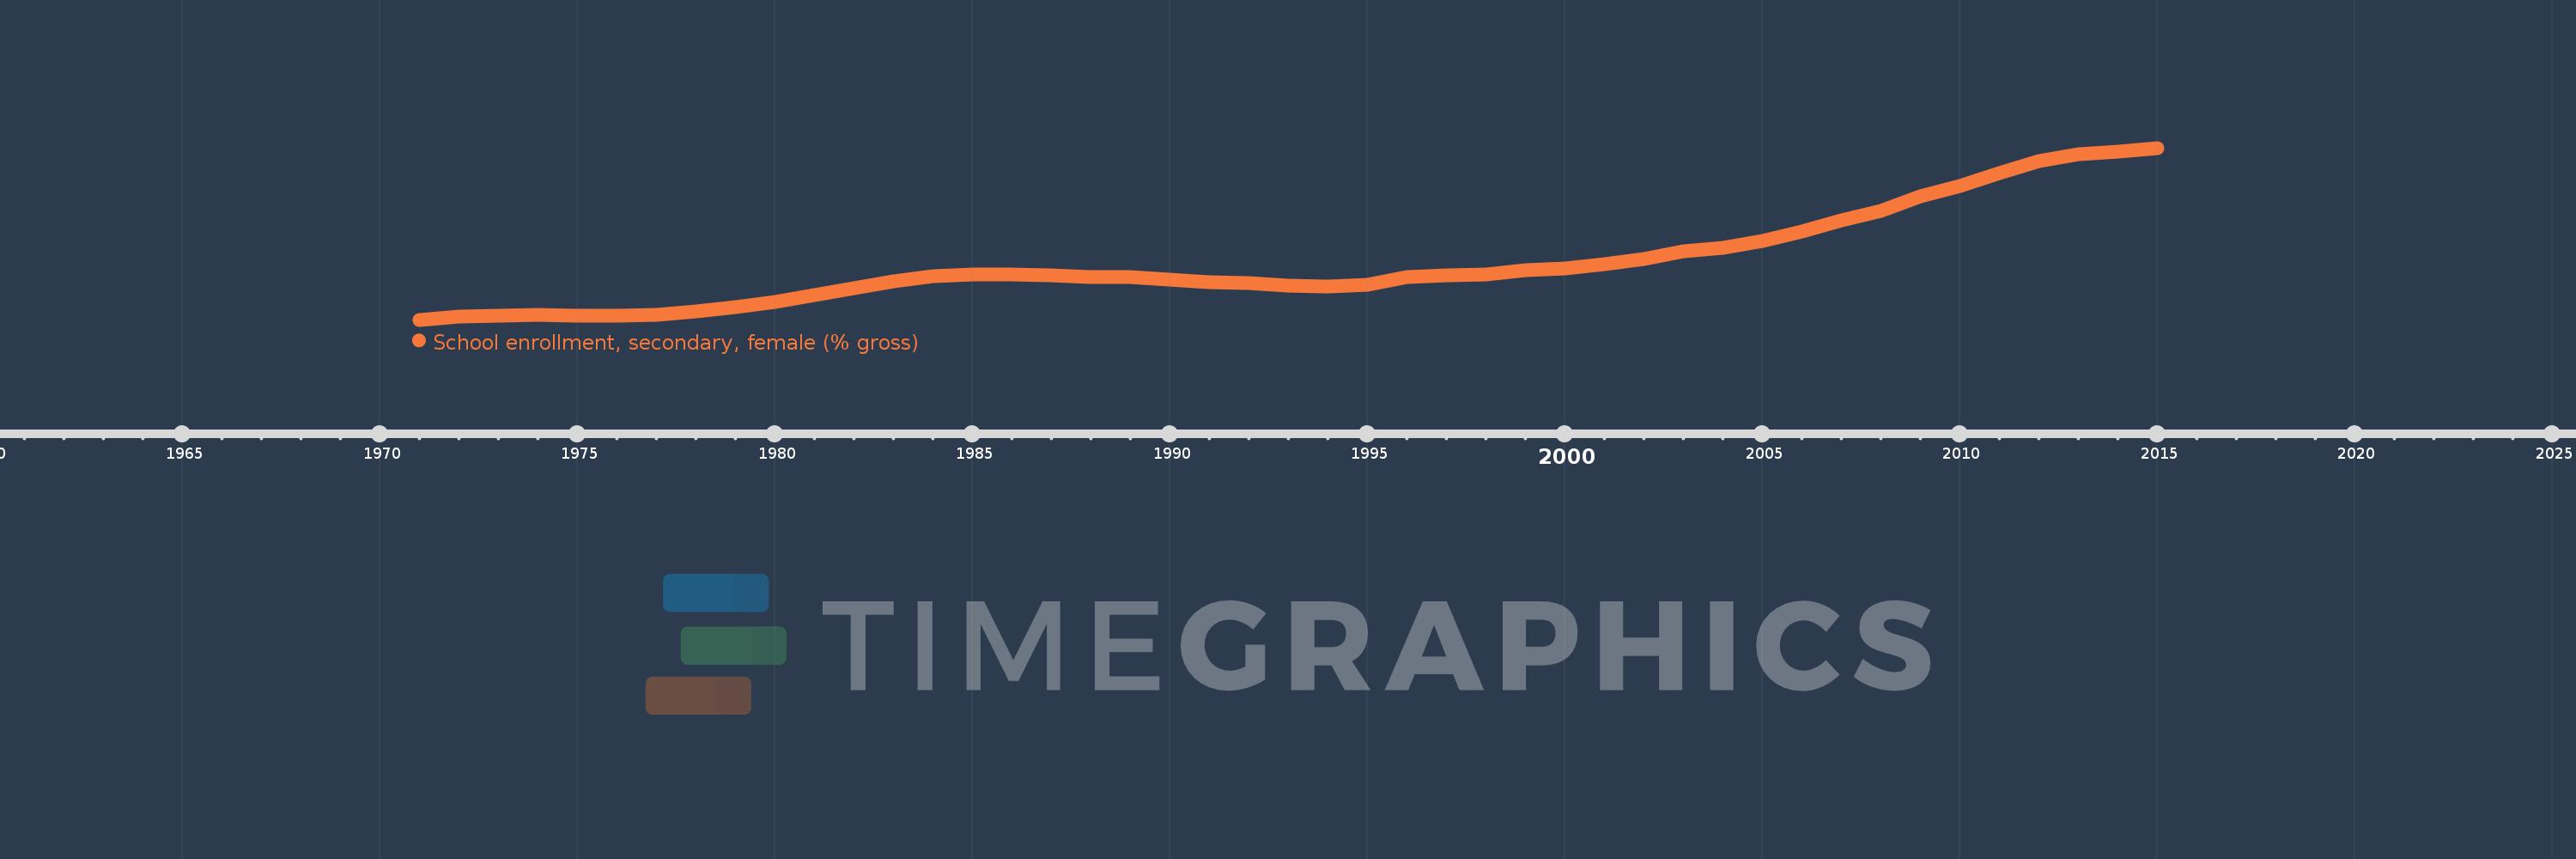
School enrollment, secondary, female (% gross)
2015,2014,2013,2012,2011,2010,2009,2008,2007,2006,2005,2004,2003,2002,2001,2000,1999,1998,1997,1996,1995,1994,1993,1992,1991,1990,1989,1988,1987,1986,1985,1984,1983,1982,1981,1980,1979,1978,1977,1976,1975,1974,1973,1972,1971
Estas estadísticas en otros países:
AfghanistanAlbaniaAlgeriaAndorraAngolaAntigua and BarbudaArab WorldArgentinaArmeniaArubaAustraliaAustriaAzerbaijanBahamas, TheBahrainBangladeshBarbadosBelarusBelgiumBelizeBeninBermudaBhutanBoliviaBosnia and HerzegovinaBotswanaBrazilBrunei DarussalamBulgariaBurkina FasoBurundiCabo VerdeCambodiaCameroonCanadaCaribbean small statesCentral African RepublicCentral Europe and the BalticsChadChileChinaColombiaComorosCongo, Dem. Rep.Congo, Rep.Costa RicaCote d'IvoireCroatiaCubaCuracaoCyprusCzech RepublicDenmarkDjiboutiDominicaDominican RepublicEarly-demographic dividendEast Asia & PacificEast Asia & Pacific (excluding high income)East Asia & Pacific (IDA & IBRD countries)EcuadorEgypt, Arab Rep.El SalvadorEquatorial GuineaEritreaEstoniaEthiopiaEuro areaEurope & Central AsiaEurope & Central Asia (excluding high income)Europe & Central Asia (IDA & IBRD countries)European UnionFijiFinlandFragile and conflict affected situationsFranceGabonGambia, TheGeorgiaGermanyGhanaGreeceGrenadaGuatemalaGuineaGuinea-BissauGuyanaHeavily indebted poor countries (HIPC)High incomeHondurasHong Kong SAR, ChinaHungaryIBRD onlyIcelandIDA & IBRD totalIDA blendIDA onlyIDA totalIndiaIndonesiaIran, Islamic Rep.IraqIrelandIsraelItalyJamaicaJapanJordanKazakhstanKenyaKiribatiKorea, Dem. People’s Rep.Korea, Rep.KuwaitKyrgyz RepublicLao PDRLate-demographic dividendLatin America & Caribbean Latin America & Caribbean (excluding high income)Latin America & the Caribbean (IDA & IBRD countries)LatviaLeast developed countries: UN classificationLebanonLesothoLiberiaLibyaLiechtensteinLithuaniaLow & middle incomeLow incomeLower middle incomeLuxembourgMacao SAR, ChinaMacedonia, FYRMadagascarMalawiMaldivesMaliMaltaMarshall IslandsMauritaniaMauritiusMexicoMicronesia, Fed. Sts.Middle East & North AfricaMiddle East & North Africa (excluding high income)Middle East & North Africa (IDA & IBRD countries)Middle incomeMoldovaMongoliaMontenegroMoroccoMozambiqueMyanmarNamibiaNauruNepalNetherlandsNew ZealandNicaraguaNigerNigeriaNorth AmericaNorwayOECD membersOmanOther small statesPacific island small statesPakistanPalauPanamaPapua New GuineaParaguayPeruPhilippinesPolandPortugalPost-demographic dividendPre-demographic dividendPuerto RicoQatarRomaniaRussian FederationRwandaSamoaSan MarinoSao Tome and PrincipeSaudi ArabiaSenegalSerbiaSeychellesSierra LeoneSlovak RepublicSloveniaSmall statesSolomon IslandsSomaliaSouth AfricaSouth AsiaSouth Asia (IDA & IBRD)SpainSri LankaSt. Kitts and NevisSt. LuciaSt. Vincent and the GrenadinesSub-Saharan Africa Sub-Saharan Africa (excluding high income)Sub-Saharan Africa (IDA & IBRD countries)SudanSurinameSwazilandSwedenSwitzerlandSyrian Arab RepublicTajikistanTanzaniaThailandTimor-LesteTogoTongaTrinidad and TobagoTunisiaTurkeyTurkmenistanTuvaluUgandaUkraineUnited Arab EmiratesUnited KingdomUnited StatesUpper middle incomeUruguayUzbekistanVanuatuVenezuela, RBVietnamWest Bank and GazaWorldYemen, Rep.ZambiaZimbabwe línea de tiempo (timeline):
En esta escala de tiempo se presenta un gráfico de 1971 y 2015 de Low income. Los datos de 1970 están ausentes. El número de observaciones reales por fecha: 45.
Fuente (nombre):
Indicadores del desarrollo mundial
Fuente (organización):
United Nations Educational, Scientific, and Cultural Organization (UNESCO) Institute for Statistics.
Categorías:
Education, Gender
Se ha actualizado:
23 abr 2017 año
Los indicadores de los cambios de valor en los últimos años
Mínimo:
10.499
1 ene 1971 año
Máximo:
36.451
1 ene 2015 año
A la fecha de observación
Valor
Cambio absoluto
El cambio con respecto al valor anterior
1 ene 1971 año
10.499
+10.499
0.0%
1 ene 1972 año
10.988
+0.489
4.66%
1 ene 1973 año
11.14
+0.151
1.38%
1 ene 1974 año
11.261
+0.122
1.09%
1 ene 1975 año
11.165
-0.096
-0.85%
1 ene 1976 año
11.16
-0.005
-0.05%
1 ene 1977 año
11.267
+0.107
0.96%
1 ene 1978 año
11.732
+0.465
4.13%
1 ene 1979 año
12.364
+0.631
5.38%
1 ene 1980 año
13.231
+0.867
7.02%
1 ene 1981 año
14.226
+0.995
7.52%
1 ene 1982 año
15.227
+1.001
7.03%
1 ene 1983 año
16.353
+1.127
7.4%
1 ene 1984 año
17.021
+0.668
4.08%
1 ene 1985 año
17.395
+0.374
2.2%
1 ene 1986 año
17.336
-0.059
-0.34%
1 ene 1987 año
17.156
-0.18
-1.04%
1 ene 1988 año
16.967
-0.188
-1.1%
1 ene 1989 año
16.961
-0.006
-0.04%
1 ene 1990 año
16.572
-0.389
-2.29%
1 ene 1991 año
16.184
-0.388
-2.34%
1 ene 1992 año
15.995
-0.189
-1.17%
1 ene 1993 año
15.656
-0.339
-2.12%
1 ene 1994 año
15.551
-0.105
-0.67%
1 ene 1995 año
15.718
+0.167
1.07%
1 ene 1996 año
16.955
+1.237
7.87%
1 ene 1997 año
17.253
+0.298
1.76%
1 ene 1998 año
17.341
+0.088
0.51%
1 ene 1999 año
17.962
+0.621
3.58%
1 ene 2000 año
18.281
+0.318
1.77%
1 ene 2001 año
18.86
+0.579
3.17%
1 ene 2002 año
19.67
+0.81
4.3%
1 ene 2003 año
20.778
+1.108
5.64%
1 ene 2004 año
21.413
+0.635
3.06%
1 ene 2005 año
22.35
+0.937
4.37%
1 ene 2006 año
23.875
+1.525
6.82%
1 ene 2007 año
25.472
+1.597
6.69%
1 ene 2008 año
26.884
+1.412
5.54%
1 ene 2009 año
29.159
+2.276
8.46%
1 ene 2010 año
30.682
+1.523
5.22%
1 ene 2011 año
32.705
+2.022
6.59%
1 ene 2012 año
34.417
+1.713
5.24%
1 ene 2013 año
35.462
+1.045
3.04%
1 ene 2014 año
35.947
+0.485
1.37%
1 ene 2015 año
36.451
+0.504
1.4%
Ranking de los países por los datos estadísticos actuales


Comentarios: