29
/es/
es
AIzaSyAYiBZKx7MnpbEhh9jyipgxe19OcubqV5w
April 1, 2024
28686
East Asia & Pacific (excluding high income)
EAP
false
2
1
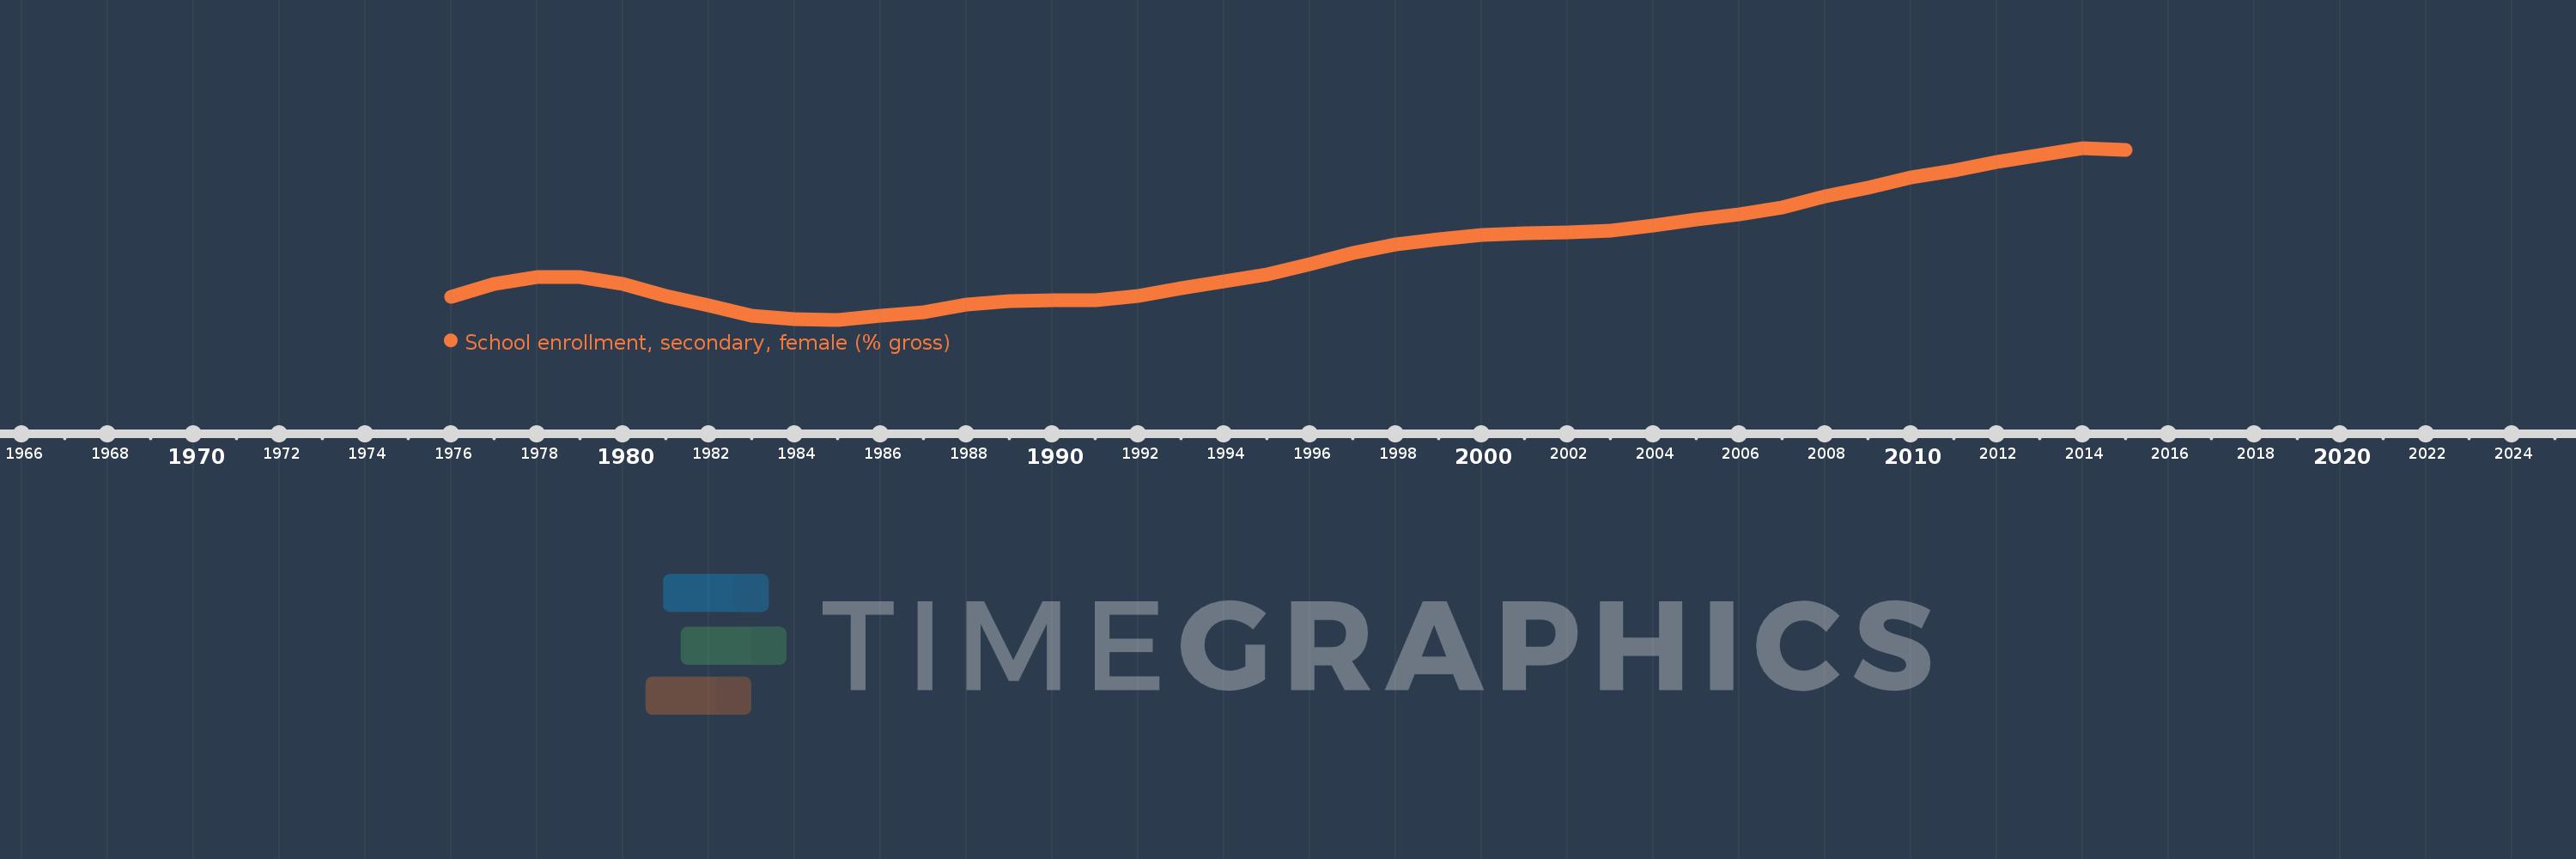
School enrollment, secondary, female (% gross)
2015,2014,2013,2012,2011,2010,2009,2008,2007,2006,2005,2004,2003,2002,2001,2000,1999,1998,1997,1996,1995,1994,1993,1992,1991,1990,1989,1988,1987,1986,1985,1984,1983,1982,1981,1980,1979,1978,1977,1976
Estas estadísticas en otros países:
AfghanistanAlbaniaAlgeriaAndorraAngolaAntigua and BarbudaArab WorldArgentinaArmeniaArubaAustraliaAustriaAzerbaijanBahamas, TheBahrainBangladeshBarbadosBelarusBelgiumBelizeBeninBermudaBhutanBoliviaBosnia and HerzegovinaBotswanaBrazilBrunei DarussalamBulgariaBurkina FasoBurundiCabo VerdeCambodiaCameroonCanadaCaribbean small statesCentral African RepublicCentral Europe and the BalticsChadChileChinaColombiaComorosCongo, Dem. Rep.Congo, Rep.Costa RicaCote d'IvoireCroatiaCubaCuracaoCyprusCzech RepublicDenmarkDjiboutiDominicaDominican RepublicEarly-demographic dividendEast Asia & PacificEast Asia & Pacific (excluding high income)East Asia & Pacific (IDA & IBRD countries)EcuadorEgypt, Arab Rep.El SalvadorEquatorial GuineaEritreaEstoniaEthiopiaEuro areaEurope & Central AsiaEurope & Central Asia (excluding high income)Europe & Central Asia (IDA & IBRD countries)European UnionFijiFinlandFragile and conflict affected situationsFranceGabonGambia, TheGeorgiaGermanyGhanaGreeceGrenadaGuatemalaGuineaGuinea-BissauGuyanaHeavily indebted poor countries (HIPC)High incomeHondurasHong Kong SAR, ChinaHungaryIBRD onlyIcelandIDA & IBRD totalIDA blendIDA onlyIDA totalIndiaIndonesiaIran, Islamic Rep.IraqIrelandIsraelItalyJamaicaJapanJordanKazakhstanKenyaKiribatiKorea, Dem. People’s Rep.Korea, Rep.KuwaitKyrgyz RepublicLao PDRLate-demographic dividendLatin America & Caribbean Latin America & Caribbean (excluding high income)Latin America & the Caribbean (IDA & IBRD countries)LatviaLeast developed countries: UN classificationLebanonLesothoLiberiaLibyaLiechtensteinLithuaniaLow & middle incomeLow incomeLower middle incomeLuxembourgMacao SAR, ChinaMacedonia, FYRMadagascarMalawiMaldivesMaliMaltaMarshall IslandsMauritaniaMauritiusMexicoMicronesia, Fed. Sts.Middle East & North AfricaMiddle East & North Africa (excluding high income)Middle East & North Africa (IDA & IBRD countries)Middle incomeMoldovaMongoliaMontenegroMoroccoMozambiqueMyanmarNamibiaNauruNepalNetherlandsNew ZealandNicaraguaNigerNigeriaNorth AmericaNorwayOECD membersOmanOther small statesPacific island small statesPakistanPalauPanamaPapua New GuineaParaguayPeruPhilippinesPolandPortugalPost-demographic dividendPre-demographic dividendPuerto RicoQatarRomaniaRussian FederationRwandaSamoaSan MarinoSao Tome and PrincipeSaudi ArabiaSenegalSerbiaSeychellesSierra LeoneSlovak RepublicSloveniaSmall statesSolomon IslandsSomaliaSouth AfricaSouth AsiaSouth Asia (IDA & IBRD)SpainSri LankaSt. Kitts and NevisSt. LuciaSt. Vincent and the GrenadinesSub-Saharan Africa Sub-Saharan Africa (excluding high income)Sub-Saharan Africa (IDA & IBRD countries)SudanSurinameSwazilandSwedenSwitzerlandSyrian Arab RepublicTajikistanTanzaniaThailandTimor-LesteTogoTongaTrinidad and TobagoTunisiaTurkeyTurkmenistanTuvaluUgandaUkraineUnited Arab EmiratesUnited KingdomUnited StatesUpper middle incomeUruguayUzbekistanVanuatuVenezuela, RBVietnamWest Bank and GazaWorldYemen, Rep.ZambiaZimbabwe línea de tiempo (timeline):
En esta escala de tiempo se presenta un gráfico de 1976 y 2015 de East Asia & Pacific (excluding high income). Los datos de 1975 están ausentes. El número de observaciones reales por fecha: 40.
Fuente (nombre):
Indicadores del desarrollo mundial
Fuente (organización):
United Nations Educational, Scientific, and Cultural Organization (UNESCO) Institute for Statistics.
Categorías:
Education, Gender
Se ha actualizado:
23 abr 2017 año
Los indicadores de los cambios de valor en los últimos años
Mínimo:
27.983
1 ene 1985 año
Máximo:
87.622
1 ene 2014 año
A la fecha de observación
Valor
Cambio absoluto
El cambio con respecto al valor anterior
1 ene 1976 año
35.916
+35.916
0.0%
1 ene 1977 año
40.359
+4.443
12.37%
1 ene 1978 año
42.85
+2.492
6.17%
1 ene 1979 año
42.892
+0.042
0.1%
1 ene 1980 año
40.423
-2.469
-5.76%
1 ene 1981 año
36.096
-4.326
-10.7%
1 ene 1982 año
32.865
-3.231
-8.95%
1 ene 1983 año
29.253
-3.612
-10.99%
1 ene 1984 año
28.144
-1.109
-3.79%
1 ene 1985 año
27.983
-0.161
-0.57%
1 ene 1986 año
29.412
+1.429
5.11%
1 ene 1987 año
30.654
+1.242
4.22%
1 ene 1988 año
33.137
+2.483
8.1%
1 ene 1989 año
34.371
+1.233
3.72%
1 ene 1990 año
34.841
+0.471
1.37%
1 ene 1991 año
34.674
-0.167
-0.48%
1 ene 1992 año
36.357
+1.683
4.85%
1 ene 1993 año
38.997
+2.64
7.26%
1 ene 1994 año
41.275
+2.278
5.84%
1 ene 1995 año
43.797
+2.522
6.11%
1 ene 1996 año
47.395
+3.598
8.22%
1 ene 1997 año
51.3
+3.905
8.24%
1 ene 1998 año
53.996
+2.696
5.26%
1 ene 1999 año
55.959
+1.963
3.64%
1 ene 2000 año
57.503
+1.544
2.76%
1 ene 2001 año
57.941
+0.438
0.76%
1 ene 2002 año
58.255
+0.313
0.54%
1 ene 2003 año
58.943
+0.688
1.18%
1 ene 2004 año
60.771
+1.828
3.1%
1 ene 2005 año
62.889
+2.118
3.49%
1 ene 2006 año
64.434
+1.545
2.46%
1 ene 2007 año
66.905
+2.471
3.84%
1 ene 2008 año
70.969
+4.064
6.07%
1 ene 2009 año
73.838
+2.869
4.04%
1 ene 2010 año
77.389
+3.55
4.81%
1 ene 2011 año
79.653
+2.264
2.93%
1 ene 2012 año
82.732
+3.079
3.87%
1 ene 2013 año
85.043
+2.312
2.79%
1 ene 2014 año
87.622
+2.578
3.03%
1 ene 2015 año
86.902
-0.72
-0.82%
Ranking de los países por los datos estadísticos actuales


Comentarios: