29
/es/
es
AIzaSyAYiBZKx7MnpbEhh9jyipgxe19OcubqV5w
April 1, 2024
191884
Malta
MLT
true
2
1
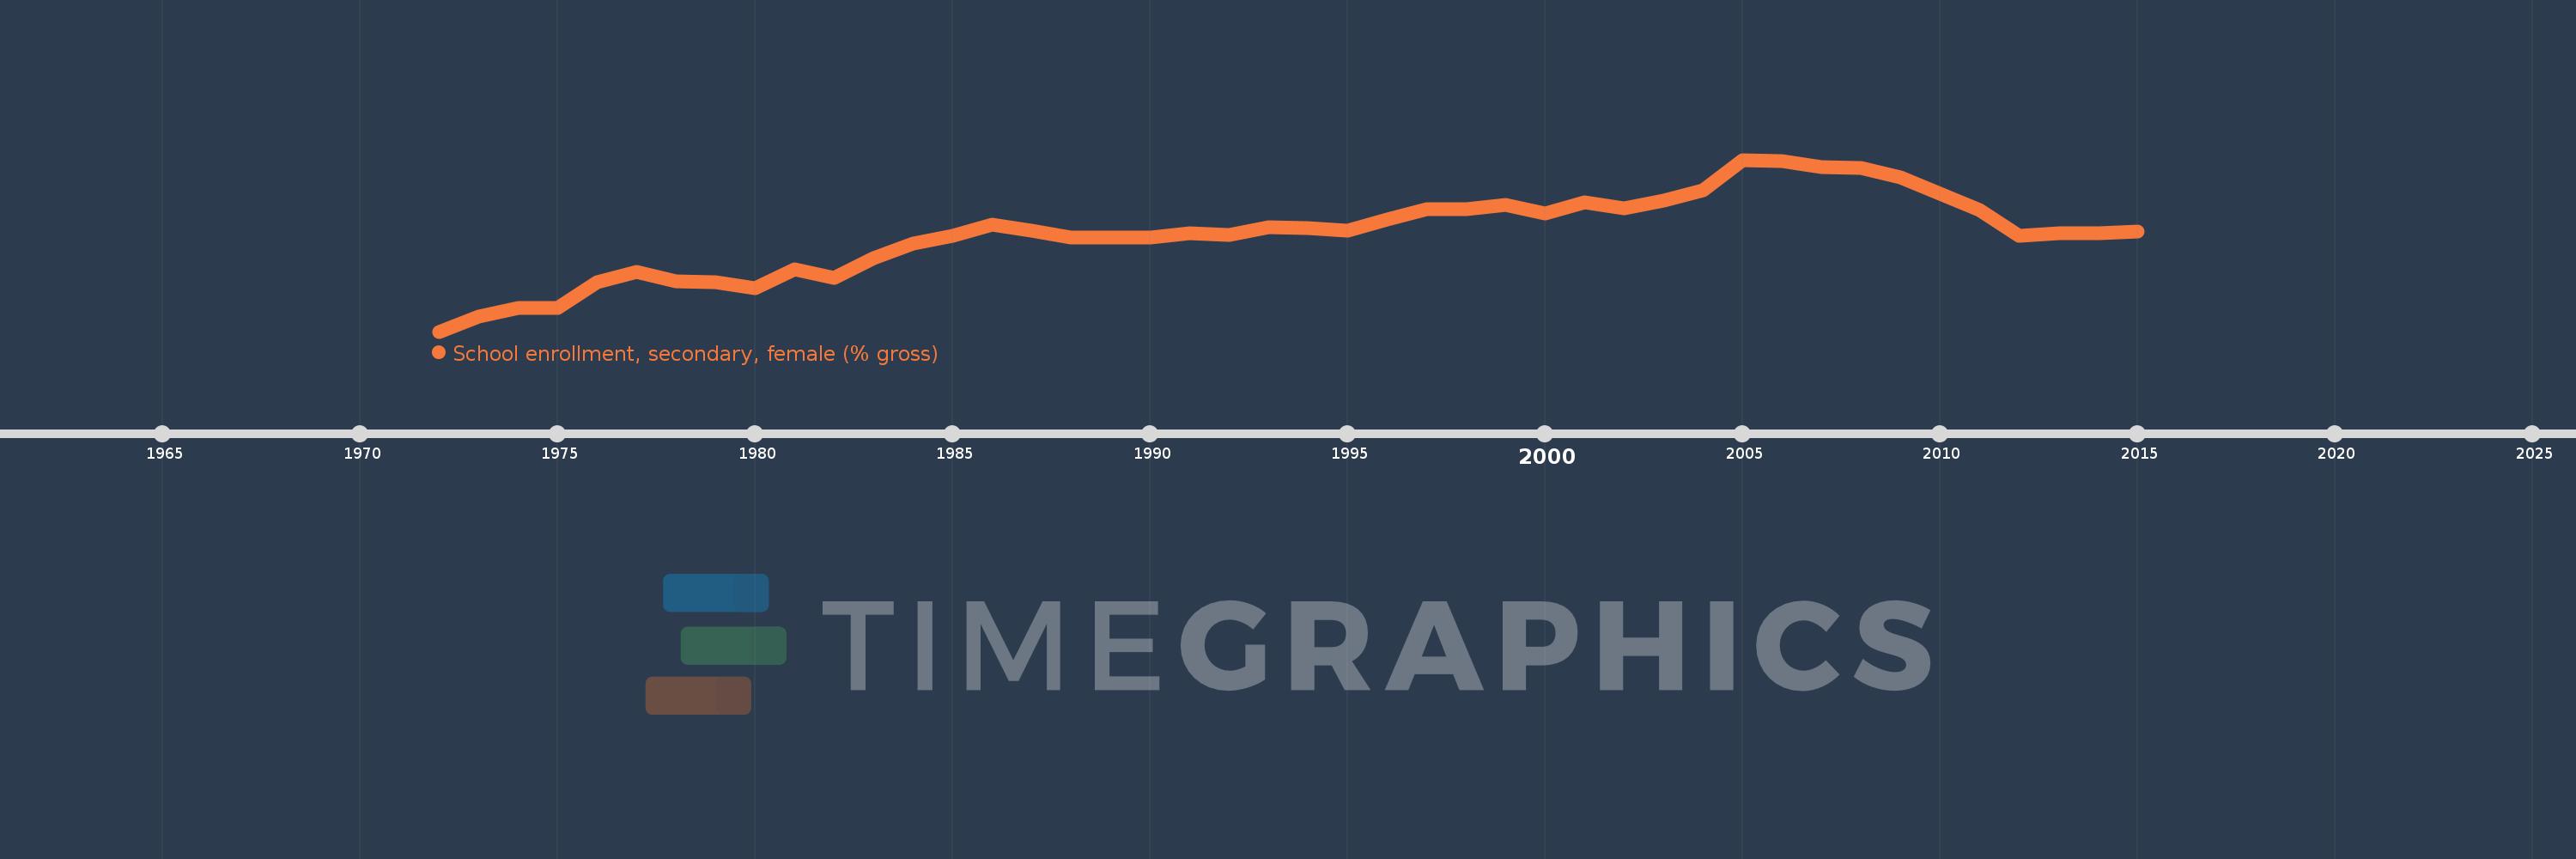
School enrollment, secondary, female (% gross)
2015,2014,2013,2012,2011,2009,2008,2007,2006,2005,2004,2003,2002,2001,2000,1999,1998,1997,1996,1995,1994,1993,1992,1991,1990,1989,1988,1987,1986,1985,1984,1983,1982,1981,1980,1979,1978,1977,1976,1975,1974,1973,1972
Estas estadísticas en otros países:
AfghanistanAlbaniaAlgeriaAndorraAngolaAntigua and BarbudaArab WorldArgentinaArmeniaArubaAustraliaAustriaAzerbaijanBahamas, TheBahrainBangladeshBarbadosBelarusBelgiumBelizeBeninBermudaBhutanBoliviaBosnia and HerzegovinaBotswanaBrazilBrunei DarussalamBulgariaBurkina FasoBurundiCabo VerdeCambodiaCameroonCanadaCaribbean small statesCentral African RepublicCentral Europe and the BalticsChadChileChinaColombiaComorosCongo, Dem. Rep.Congo, Rep.Costa RicaCote d'IvoireCroatiaCubaCuracaoCyprusCzech RepublicDenmarkDjiboutiDominicaDominican RepublicEarly-demographic dividendEast Asia & PacificEast Asia & Pacific (excluding high income)East Asia & Pacific (IDA & IBRD countries)EcuadorEgypt, Arab Rep.El SalvadorEquatorial GuineaEritreaEstoniaEthiopiaEuro areaEurope & Central AsiaEurope & Central Asia (excluding high income)Europe & Central Asia (IDA & IBRD countries)European UnionFijiFinlandFragile and conflict affected situationsFranceGabonGambia, TheGeorgiaGermanyGhanaGreeceGrenadaGuatemalaGuineaGuinea-BissauGuyanaHeavily indebted poor countries (HIPC)High incomeHondurasHong Kong SAR, ChinaHungaryIBRD onlyIcelandIDA & IBRD totalIDA blendIDA onlyIDA totalIndiaIndonesiaIran, Islamic Rep.IraqIrelandIsraelItalyJamaicaJapanJordanKazakhstanKenyaKiribatiKorea, Dem. People’s Rep.Korea, Rep.KuwaitKyrgyz RepublicLao PDRLate-demographic dividendLatin America & Caribbean Latin America & Caribbean (excluding high income)Latin America & the Caribbean (IDA & IBRD countries)LatviaLeast developed countries: UN classificationLebanonLesothoLiberiaLibyaLiechtensteinLithuaniaLow & middle incomeLow incomeLower middle incomeLuxembourgMacao SAR, ChinaMacedonia, FYRMadagascarMalawiMaldivesMaliMaltaMarshall IslandsMauritaniaMauritiusMexicoMicronesia, Fed. Sts.Middle East & North AfricaMiddle East & North Africa (excluding high income)Middle East & North Africa (IDA & IBRD countries)Middle incomeMoldovaMongoliaMontenegroMoroccoMozambiqueMyanmarNamibiaNauruNepalNetherlandsNew ZealandNicaraguaNigerNigeriaNorth AmericaNorwayOECD membersOmanOther small statesPacific island small statesPakistanPalauPanamaPapua New GuineaParaguayPeruPhilippinesPolandPortugalPost-demographic dividendPre-demographic dividendPuerto RicoQatarRomaniaRussian FederationRwandaSamoaSan MarinoSao Tome and PrincipeSaudi ArabiaSenegalSerbiaSeychellesSierra LeoneSlovak RepublicSloveniaSmall statesSolomon IslandsSomaliaSouth AfricaSouth AsiaSouth Asia (IDA & IBRD)SpainSri LankaSt. Kitts and NevisSt. LuciaSt. Vincent and the GrenadinesSub-Saharan Africa Sub-Saharan Africa (excluding high income)Sub-Saharan Africa (IDA & IBRD countries)SudanSurinameSwazilandSwedenSwitzerlandSyrian Arab RepublicTajikistanTanzaniaThailandTimor-LesteTogoTongaTrinidad and TobagoTunisiaTurkeyTurkmenistanTuvaluUgandaUkraineUnited Arab EmiratesUnited KingdomUnited StatesUpper middle incomeUruguayUzbekistanVanuatuVenezuela, RBVietnamWest Bank and GazaWorldYemen, Rep.ZambiaZimbabwe línea de tiempo (timeline):
En esta escala de tiempo se presenta un gráfico de 1972 y 2015 de Malta. Los datos de 1971 están ausentes. El número de observaciones reales por fecha: 43.
Fuente (nombre):
Indicadores del desarrollo mundial
Fuente (organización):
United Nations Educational, Scientific, and Cultural Organization (UNESCO) Institute for Statistics.
Categorías:
Education, Gender
Se ha actualizado:
23 abr 2017 año
Los indicadores de los cambios de valor en los últimos años
Mínimo:
48.978
1 ene 1972 año
Máximo:
103.404
1 ene 2005 año
A la fecha de observación
Valor
Cambio absoluto
El cambio con respecto al valor anterior
1 ene 1972 año
48.978
+48.978
0.0%
1 ene 1973 año
53.674
+4.696
9.59%
1 ene 1974 año
56.463
+2.789
5.2%
1 ene 1975 año
56.582
+0.119
0.21%
1 ene 1976 año
64.731
+8.15
14.4%
1 ene 1977 año
68.014
+3.282
5.07%
1 ene 1978 año
64.964
-3.05
-4.48%
1 ene 1979 año
64.496
-0.468
-0.72%
1 ene 1980 año
62.843
-1.652
-2.56%
1 ene 1981 año
68.758
+5.915
9.41%
1 ene 1982 año
66.014
-2.744
-3.99%
1 ene 1983 año
72.264
+6.25
9.47%
1 ene 1984 año
76.756
+4.492
6.22%
1 ene 1985 año
79.186
+2.431
3.17%
1 ene 1986 año
82.738
+3.551
4.48%
1 ene 1987 año
80.947
-1.79
-2.16%
1 ene 1988 año
78.783
-2.165
-2.67%
1 ene 1989 año
78.704
-0.079
-0.1%
1 ene 1990 año
78.725
+0.021
0.03%
1 ene 1991 año
80.159
+1.435
1.82%
1 ene 1992 año
79.539
-0.62
-0.77%
1 ene 1993 año
82.066
+2.526
3.18%
1 ene 1994 año
81.708
-0.357
-0.44%
1 ene 1995 año
81.08
-0.629
-0.77%
1 ene 1996 año
84.47
+3.39
4.18%
1 ene 1997 año
87.644
+3.174
3.76%
1 ene 1998 año
87.875
+0.231
0.26%
1 ene 1999 año
89.094
+1.219
1.39%
1 ene 2000 año
86.404
-2.69
-3.02%
1 ene 2001 año
89.807
+3.402
3.94%
1 ene 2002 año
88.067
-1.74
-1.94%
1 ene 2003 año
90.539
+2.472
2.81%
1 ene 2004 año
93.847
+3.307
3.65%
1 ene 2005 año
103.404
+9.558
10.18%
1 ene 2006 año
102.935
-0.469
-0.45%
1 ene 2007 año
101.197
-1.738
-1.69%
1 ene 2008 año
100.694
-0.504
-0.5%
1 ene 2009 año
97.753
-2.941
-2.92%
1 ene 2011 año
87.456
-10.297
-10.53%
1 ene 2012 año
79.345
-8.111
-9.27%
1 ene 2013 año
80.07
+0.725
0.91%
1 ene 2014 año
80.074
+0.005
0.01%
1 ene 2015 año
80.569
+0.495
0.62%
Ranking de los países por los datos estadísticos actuales


Comentarios: