29
/es/
es
AIzaSyAYiBZKx7MnpbEhh9jyipgxe19OcubqV5w
April 1, 2024
160978
Israel
ISR
true
2
1
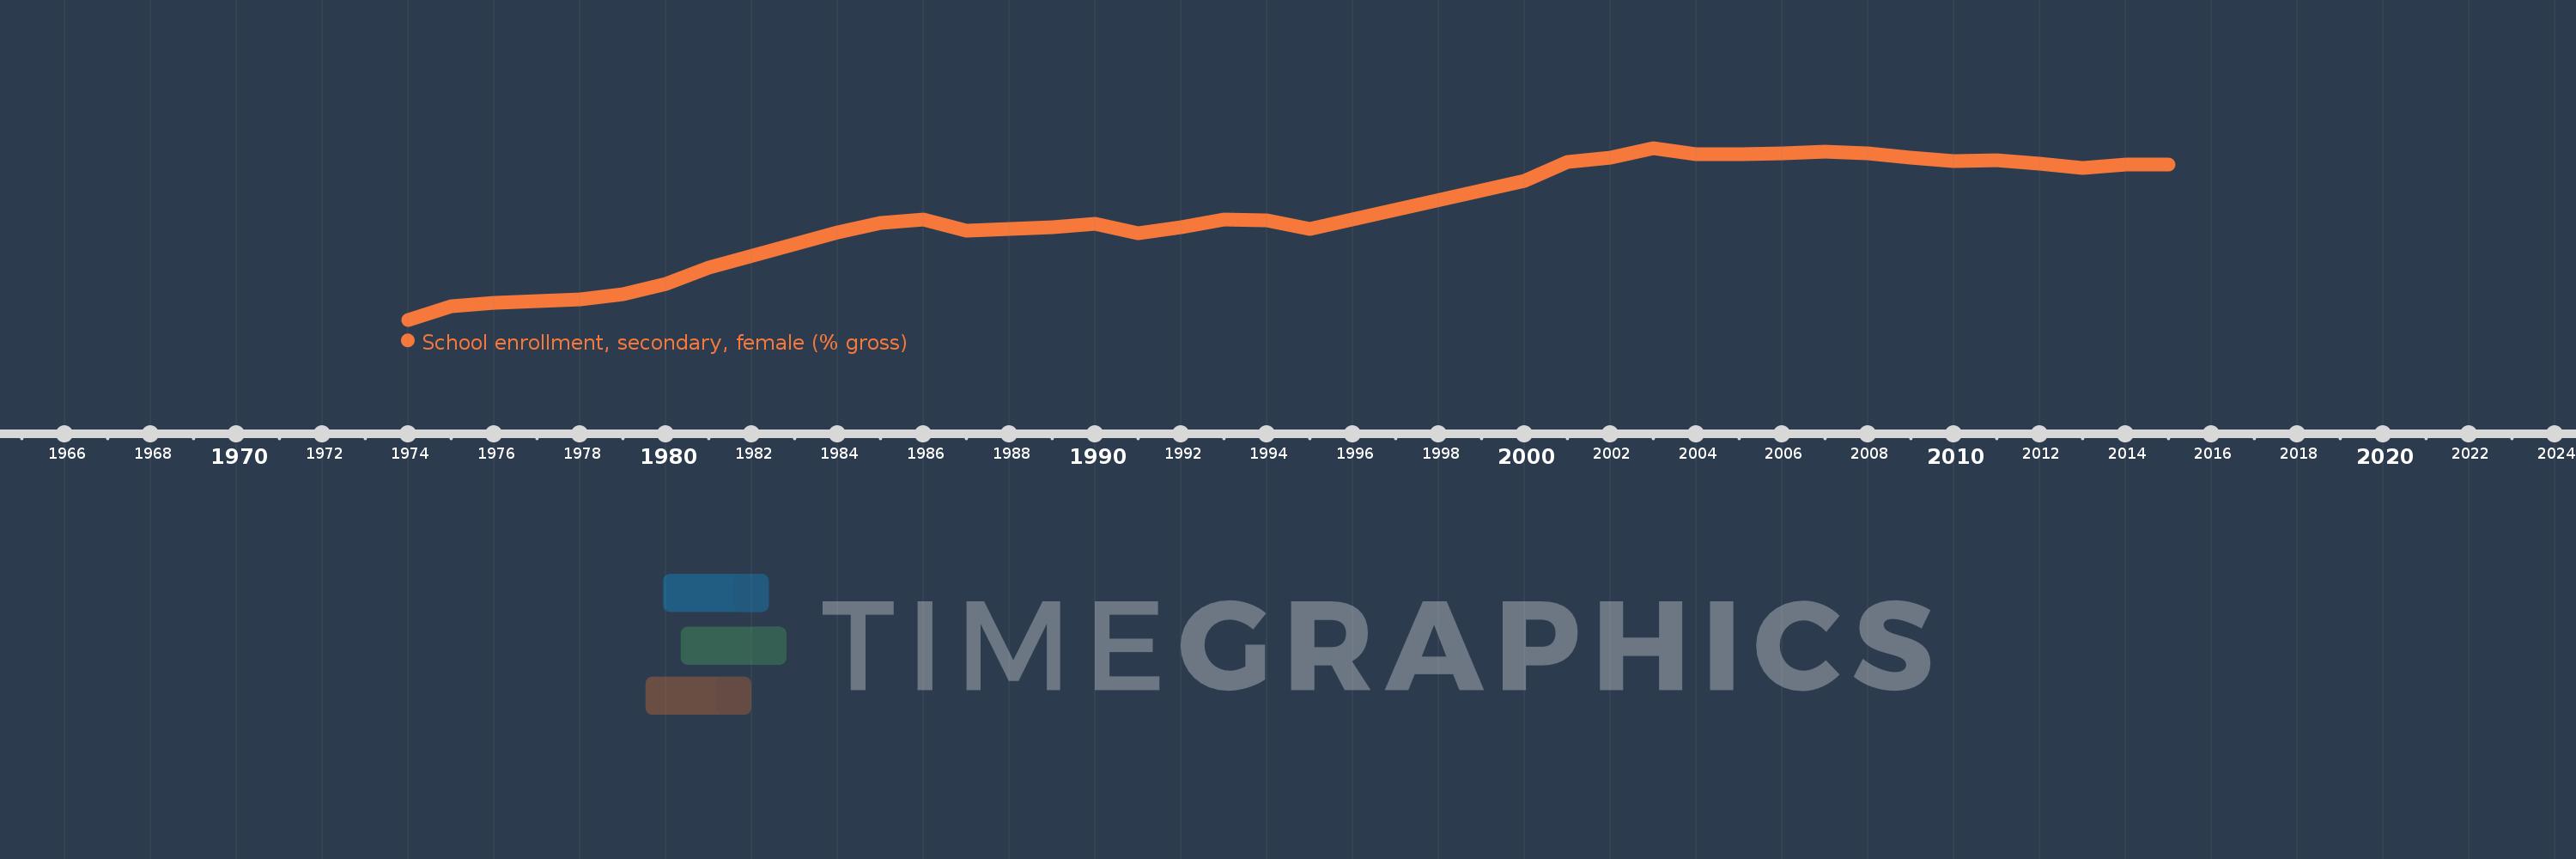
School enrollment, secondary, female (% gross)
2015,2014,2013,2012,2011,2010,2009,2008,2007,2006,2005,2004,2003,2002,2001,2000,1995,1994,1993,1992,1991,1990,1989,1988,1987,1986,1985,1984,1981,1980,1979,1978,1977,1976,1975,1974
Estas estadísticas en otros países:
AfghanistanAlbaniaAlgeriaAndorraAngolaAntigua and BarbudaArab WorldArgentinaArmeniaArubaAustraliaAustriaAzerbaijanBahamas, TheBahrainBangladeshBarbadosBelarusBelgiumBelizeBeninBermudaBhutanBoliviaBosnia and HerzegovinaBotswanaBrazilBrunei DarussalamBulgariaBurkina FasoBurundiCabo VerdeCambodiaCameroonCanadaCaribbean small statesCentral African RepublicCentral Europe and the BalticsChadChileChinaColombiaComorosCongo, Dem. Rep.Congo, Rep.Costa RicaCote d'IvoireCroatiaCubaCuracaoCyprusCzech RepublicDenmarkDjiboutiDominicaDominican RepublicEarly-demographic dividendEast Asia & PacificEast Asia & Pacific (excluding high income)East Asia & Pacific (IDA & IBRD countries)EcuadorEgypt, Arab Rep.El SalvadorEquatorial GuineaEritreaEstoniaEthiopiaEuro areaEurope & Central AsiaEurope & Central Asia (excluding high income)Europe & Central Asia (IDA & IBRD countries)European UnionFijiFinlandFragile and conflict affected situationsFranceGabonGambia, TheGeorgiaGermanyGhanaGreeceGrenadaGuatemalaGuineaGuinea-BissauGuyanaHeavily indebted poor countries (HIPC)High incomeHondurasHong Kong SAR, ChinaHungaryIBRD onlyIcelandIDA & IBRD totalIDA blendIDA onlyIDA totalIndiaIndonesiaIran, Islamic Rep.IraqIrelandIsraelItalyJamaicaJapanJordanKazakhstanKenyaKiribatiKorea, Dem. People’s Rep.Korea, Rep.KuwaitKyrgyz RepublicLao PDRLate-demographic dividendLatin America & Caribbean Latin America & Caribbean (excluding high income)Latin America & the Caribbean (IDA & IBRD countries)LatviaLeast developed countries: UN classificationLebanonLesothoLiberiaLibyaLiechtensteinLithuaniaLow & middle incomeLow incomeLower middle incomeLuxembourgMacao SAR, ChinaMacedonia, FYRMadagascarMalawiMaldivesMaliMaltaMarshall IslandsMauritaniaMauritiusMexicoMicronesia, Fed. Sts.Middle East & North AfricaMiddle East & North Africa (excluding high income)Middle East & North Africa (IDA & IBRD countries)Middle incomeMoldovaMongoliaMontenegroMoroccoMozambiqueMyanmarNamibiaNauruNepalNetherlandsNew ZealandNicaraguaNigerNigeriaNorth AmericaNorwayOECD membersOmanOther small statesPacific island small statesPakistanPalauPanamaPapua New GuineaParaguayPeruPhilippinesPolandPortugalPost-demographic dividendPre-demographic dividendPuerto RicoQatarRomaniaRussian FederationRwandaSamoaSan MarinoSao Tome and PrincipeSaudi ArabiaSenegalSerbiaSeychellesSierra LeoneSlovak RepublicSloveniaSmall statesSolomon IslandsSomaliaSouth AfricaSouth AsiaSouth Asia (IDA & IBRD)SpainSri LankaSt. Kitts and NevisSt. LuciaSt. Vincent and the GrenadinesSub-Saharan Africa Sub-Saharan Africa (excluding high income)Sub-Saharan Africa (IDA & IBRD countries)SudanSurinameSwazilandSwedenSwitzerlandSyrian Arab RepublicTajikistanTanzaniaThailandTimor-LesteTogoTongaTrinidad and TobagoTunisiaTurkeyTurkmenistanTuvaluUgandaUkraineUnited Arab EmiratesUnited KingdomUnited StatesUpper middle incomeUruguayUzbekistanVanuatuVenezuela, RBVietnamWest Bank and GazaWorldYemen, Rep.ZambiaZimbabwe línea de tiempo (timeline):
En esta escala de tiempo se presenta un gráfico de 1974 y 2015 de Israel. Los datos de 1973 están ausentes. El número de observaciones reales por fecha: 36.
Fuente (nombre):
Indicadores del desarrollo mundial
Fuente (organización):
United Nations Educational, Scientific, and Cultural Organization (UNESCO) Institute for Statistics.
Categorías:
Education, Gender
Se ha actualizado:
23 abr 2017 año
Los indicadores de los cambios de valor en los últimos años
Mínimo:
77.572
1 ene 1974 año
Máximo:
105.276
1 ene 2003 año
A la fecha de observación
Valor
Cambio absoluto
El cambio con respecto al valor anterior
1 ene 1974 año
77.572
+77.572
0.0%
1 ene 1975 año
79.804
+2.232
2.88%
1 ene 1976 año
80.256
+0.452
0.57%
1 ene 1977 año
80.525
+0.269
0.34%
1 ene 1978 año
80.796
+0.271
0.34%
1 ene 1979 año
81.665
+0.869
1.08%
1 ene 1980 año
83.317
+1.652
2.02%
1 ene 1981 año
85.936
+2.619
3.14%
1 ene 1984 año
91.599
+5.663
6.59%
1 ene 1985 año
93.115
+1.516
1.66%
1 ene 1986 año
93.67
+0.555
0.6%
1 ene 1987 año
91.94
-1.73
-1.85%
1 ene 1988 año
92.16
+0.219
0.24%
1 ene 1989 año
92.456
+0.296
0.32%
1 ene 1990 año
93.111
+0.655
0.71%
1 ene 1991 año
91.475
-1.636
-1.76%
1 ene 1992 año
92.518
+1.043
1.14%
1 ene 1993 año
93.781
+1.263
1.37%
1 ene 1994 año
93.56
-0.221
-0.24%
1 ene 1995 año
92.192
-1.368
-1.46%
1 ene 2000 año
99.919
+7.727
8.38%
1 ene 2001 año
103.04
+3.121
3.12%
1 ene 2002 año
103.648
+0.608
0.59%
1 ene 2003 año
105.276
+1.628
1.57%
1 ene 2004 año
104.209
-1.067
-1.01%
1 ene 2005 año
104.309
+0.1
0.1%
1 ene 2006 año
104.42
+0.111
0.11%
1 ene 2007 año
104.668
+0.249
0.24%
1 ene 2008 año
104.449
-0.22
-0.21%
1 ene 2009 año
103.756
-0.693
-0.66%
1 ene 2010 año
103.106
-0.65
-0.63%
1 ene 2011 año
103.306
+0.201
0.19%
1 ene 2012 año
102.75
-0.556
-0.54%
1 ene 2013 año
102.113
-0.637
-0.62%
1 ene 2014 año
102.554
+0.441
0.43%
1 ene 2015 año
102.664
+0.11
0.11%
Ranking de los países por los datos estadísticos actuales


Comentarios: