29
/es/
es
AIzaSyAYiBZKx7MnpbEhh9jyipgxe19OcubqV5w
April 1, 2024
45197
Low & middle income
LMY
false
2
1
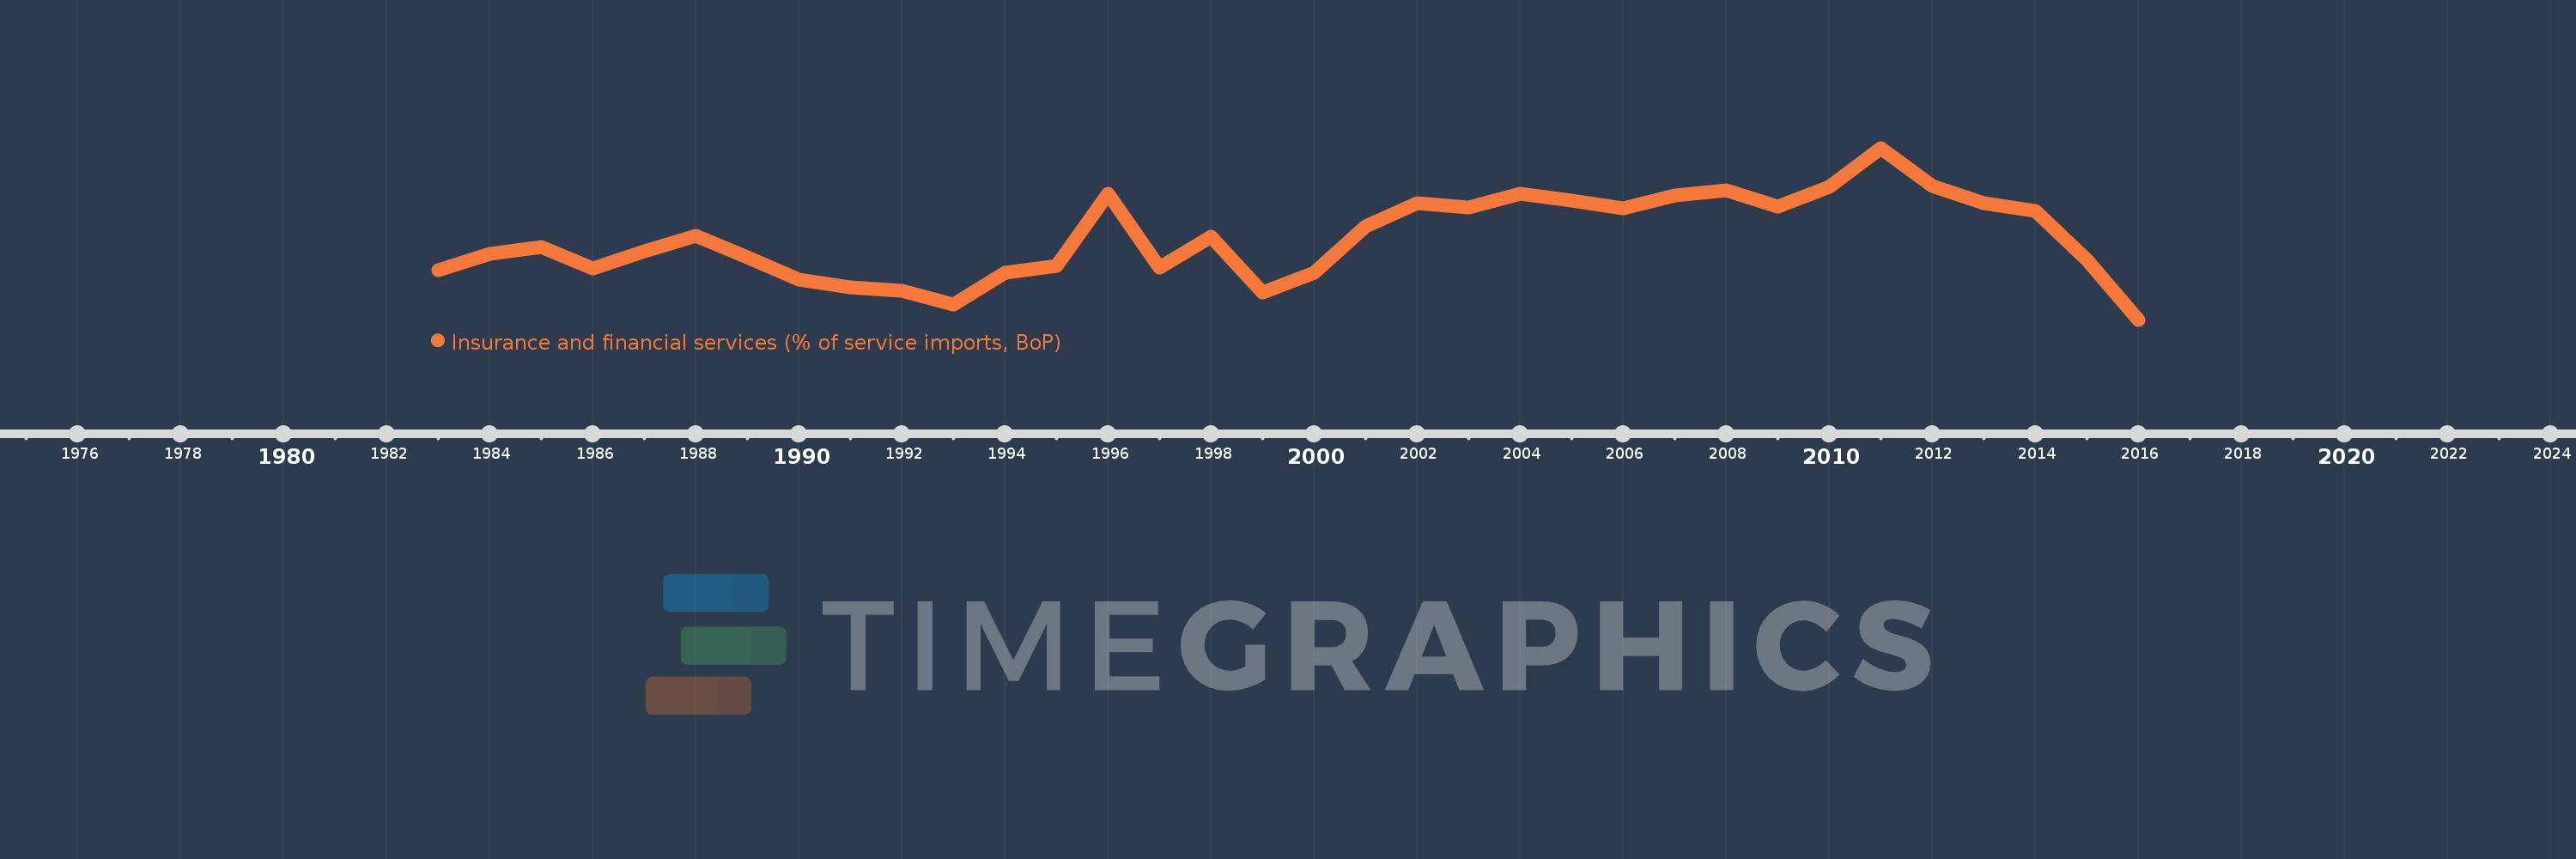
Insurance and financial services (% of service imports, BoP)
2016,2015,2014,2013,2012,2011,2010,2009,2008,2007,2006,2005,2004,2003,2002,2001,2000,1999,1998,1997,1996,1995,1994,1993,1992,1991,1990,1989,1988,1987,1986,1985,1984,1983
Estas estadísticas en otros países:
AfghanistanAlbaniaAlgeriaAngolaAntigua and BarbudaArab WorldArgentinaArmeniaArubaAustraliaAustriaAzerbaijanBahamas, TheBahrainBangladeshBarbadosBelarusBelgiumBelizeBeninBermudaBhutanBoliviaBosnia and HerzegovinaBotswanaBrazilBrunei DarussalamBulgariaBurkina FasoBurundiCabo VerdeCambodiaCameroonCanadaCaribbean small statesCentral African RepublicCentral Europe and the BalticsChadChileChinaColombiaComorosCongo, Dem. Rep.Congo, Rep.Costa RicaCote d'IvoireCroatiaCuracaoCyprusCzech RepublicDenmarkDjiboutiDominicaDominican RepublicEarly-demographic dividendEast Asia & PacificEast Asia & Pacific (excluding high income)East Asia & Pacific (IDA & IBRD countries)EcuadorEgypt, Arab Rep.El SalvadorEquatorial GuineaEritreaEstoniaEthiopiaEuro areaEurope & Central AsiaEurope & Central Asia (excluding high income)Europe & Central Asia (IDA & IBRD countries)European UnionFaroe IslandsFijiFinlandFragile and conflict affected situationsFranceFrench PolynesiaGabonGambia, TheGeorgiaGermanyGhanaGreeceGrenadaGuatemalaGuineaGuinea-BissauGuyanaHaitiHeavily indebted poor countries (HIPC)High incomeHondurasHong Kong SAR, ChinaHungaryIBRD onlyIcelandIDA & IBRD totalIDA onlyIDA totalIndiaIndonesiaIran, Islamic Rep.IraqIrelandIsraelItalyJamaicaJapanJordanKazakhstanKenyaKiribatiKorea, Rep.KosovoKuwaitKyrgyz RepublicLao PDRLate-demographic dividendLatin America & Caribbean Latin America & Caribbean (excluding high income)Latin America & the Caribbean (IDA & IBRD countries)LatviaLeast developed countries: UN classificationLebanonLesothoLiberiaLibyaLithuaniaLow & middle incomeLow incomeLower middle incomeLuxembourgMacao SAR, ChinaMacedonia, FYRMadagascarMalawiMalaysiaMaldivesMaliMaltaMarshall IslandsMauritaniaMauritiusMexicoMicronesia, Fed. Sts.Middle East & North AfricaMiddle East & North Africa (excluding high income)Middle East & North Africa (IDA & IBRD countries)Middle incomeMoldovaMongoliaMontenegroMoroccoMozambiqueMyanmarNamibiaNepalNetherlandsNew CaledoniaNew ZealandNicaraguaNigerNigeriaNorth AmericaNorwayOECD membersOmanOther small statesPacific island small statesPakistanPalauPanamaPapua New GuineaParaguayPeruPhilippinesPolandPortugalPost-demographic dividendPre-demographic dividendQatarRomaniaRussian FederationRwandaSamoaSao Tome and PrincipeSaudi ArabiaSenegalSerbiaSeychellesSierra LeoneSingaporeSint Maarten (Dutch part)Slovak RepublicSloveniaSmall statesSolomon IslandsSouth AfricaSouth AsiaSouth Asia (IDA & IBRD)South SudanSpainSri LankaSt. Kitts and NevisSt. LuciaSt. Vincent and the GrenadinesSub-Saharan Africa Sub-Saharan Africa (excluding high income)Sub-Saharan Africa (IDA & IBRD countries)SudanSurinameSwazilandSwedenSwitzerlandSyrian Arab RepublicTajikistanTanzaniaThailandTimor-LesteTogoTongaTrinidad and TobagoTunisiaTurkeyTuvaluUgandaUkraineUnited KingdomUnited StatesUpper middle incomeUruguayVanuatuVenezuela, RBWest Bank and GazaWorldYemen, Rep.ZambiaZimbabwe línea de tiempo (timeline):
En esta escala de tiempo se presenta un gráfico de 1983 y 2016 de Low & middle income. Los datos de 1982 están ausentes. El número de observaciones reales por fecha: 34.
Fuente (nombre):
Indicadores del desarrollo mundial
Fuente (organización):
International Monetary Fund, Balance of Payments Statistics Yearbook and data files.
Categorías:
Economy & Growth, Private Sector, Trade
Se ha actualizado:
23 abr 2017 año
Los indicadores de los cambios de valor en los últimos años
Mínimo:
4.759
1 ene 2016 año
Máximo:
7.796
1 ene 2011 año
A la fecha de observación
Valor
Cambio absoluto
El cambio con respecto al valor anterior
1 ene 1983 año
5.631
+5.631
0.0%
1 ene 1984 año
5.921
+0.29
5.14%
1 ene 1985 año
6.043
+0.122
2.06%
1 ene 1986 año
5.661
-0.382
-6.32%
1 ene 1987 año
5.965
+0.304
5.36%
1 ene 1988 año
6.243
+0.278
4.67%
1 ene 1989 año
5.865
-0.378
-6.05%
1 ene 1990 año
5.468
-0.397
-6.78%
1 ene 1991 año
5.325
-0.143
-2.62%
1 ene 1992 año
5.272
-0.052
-0.99%
1 ene 1993 año
5.022
-0.25
-4.74%
1 ene 1994 año
5.596
+0.574
11.42%
1 ene 1995 año
5.718
+0.122
2.18%
1 ene 1996 año
6.994
+1.276
22.31%
1 ene 1997 año
5.685
-1.309
-18.71%
1 ene 1998 año
6.231
+0.546
9.61%
1 ene 1999 año
5.238
-0.993
-15.94%
1 ene 2000 año
5.597
+0.359
6.85%
1 ene 2001 año
6.411
+0.814
14.54%
1 ene 2002 año
6.816
+0.406
6.33%
1 ene 2003 año
6.748
-0.068
-1.0%
1 ene 2004 año
6.984
+0.236
3.5%
1 ene 2005 año
6.871
-0.113
-1.62%
1 ene 2006 año
6.736
-0.135
-1.97%
1 ene 2007 año
6.962
+0.226
3.36%
1 ene 2008 año
7.04
+0.078
1.11%
1 ene 2009 año
6.752
-0.287
-4.08%
1 ene 2010 año
7.102
+0.35
5.18%
1 ene 2011 año
7.796
+0.694
9.77%
1 ene 2012 año
7.121
-0.676
-8.67%
1 ene 2013 año
6.815
-0.306
-4.29%
1 ene 2014 año
6.683
-0.132
-1.94%
1 ene 2015 año
5.811
-0.872
-13.04%
1 ene 2016 año
4.759
-1.052
-18.11%
Ranking de los países por los datos estadísticos actuales


Comentarios: