29
/es/
es
AIzaSyAYiBZKx7MnpbEhh9jyipgxe19OcubqV5w
April 1, 2024
139417
Germany
DEU
true
2
1
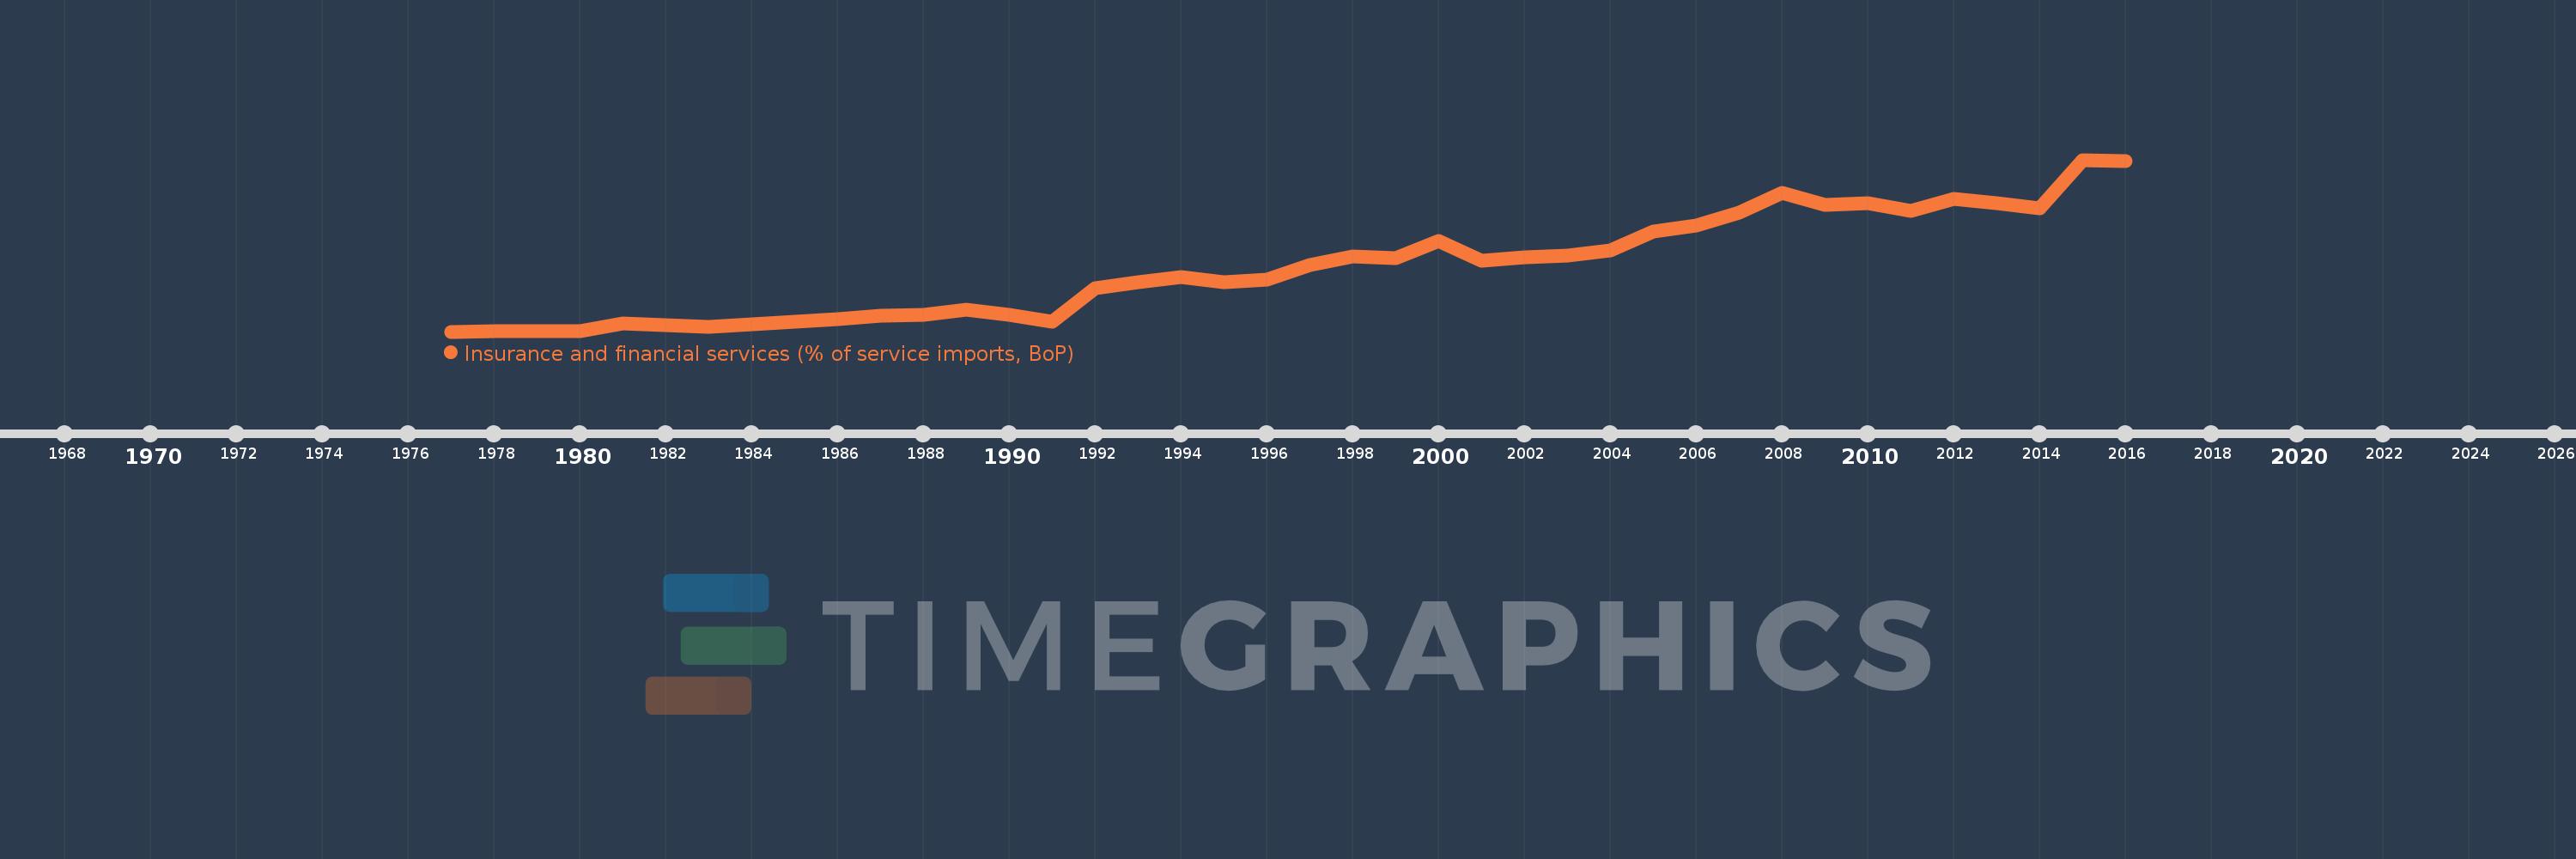
Insurance and financial services (% of service imports, BoP)
2016,2015,2014,2013,2012,2011,2010,2009,2008,2007,2006,2005,2004,2003,2002,2001,2000,1999,1998,1997,1996,1995,1994,1993,1992,1991,1990,1989,1988,1987,1986,1985,1984,1983,1982,1981,1980,1979,1978,1977
Estas estadísticas en otros países:
AfghanistanAlbaniaAlgeriaAngolaAntigua and BarbudaArab WorldArgentinaArmeniaArubaAustraliaAustriaAzerbaijanBahamas, TheBahrainBangladeshBarbadosBelarusBelgiumBelizeBeninBermudaBhutanBoliviaBosnia and HerzegovinaBotswanaBrazilBrunei DarussalamBulgariaBurkina FasoBurundiCabo VerdeCambodiaCameroonCanadaCaribbean small statesCentral African RepublicCentral Europe and the BalticsChadChileChinaColombiaComorosCongo, Dem. Rep.Congo, Rep.Costa RicaCote d'IvoireCroatiaCuracaoCyprusCzech RepublicDenmarkDjiboutiDominicaDominican RepublicEarly-demographic dividendEast Asia & PacificEast Asia & Pacific (excluding high income)East Asia & Pacific (IDA & IBRD countries)EcuadorEgypt, Arab Rep.El SalvadorEquatorial GuineaEritreaEstoniaEthiopiaEuro areaEurope & Central AsiaEurope & Central Asia (excluding high income)Europe & Central Asia (IDA & IBRD countries)European UnionFaroe IslandsFijiFinlandFragile and conflict affected situationsFranceFrench PolynesiaGabonGambia, TheGeorgiaGermanyGhanaGreeceGrenadaGuatemalaGuineaGuinea-BissauGuyanaHaitiHeavily indebted poor countries (HIPC)High incomeHondurasHong Kong SAR, ChinaHungaryIBRD onlyIcelandIDA & IBRD totalIDA onlyIDA totalIndiaIndonesiaIran, Islamic Rep.IraqIrelandIsraelItalyJamaicaJapanJordanKazakhstanKenyaKiribatiKorea, Rep.KosovoKuwaitKyrgyz RepublicLao PDRLate-demographic dividendLatin America & Caribbean Latin America & Caribbean (excluding high income)Latin America & the Caribbean (IDA & IBRD countries)LatviaLeast developed countries: UN classificationLebanonLesothoLiberiaLibyaLithuaniaLow & middle incomeLow incomeLower middle incomeLuxembourgMacao SAR, ChinaMacedonia, FYRMadagascarMalawiMalaysiaMaldivesMaliMaltaMarshall IslandsMauritaniaMauritiusMexicoMicronesia, Fed. Sts.Middle East & North AfricaMiddle East & North Africa (excluding high income)Middle East & North Africa (IDA & IBRD countries)Middle incomeMoldovaMongoliaMontenegroMoroccoMozambiqueMyanmarNamibiaNepalNetherlandsNew CaledoniaNew ZealandNicaraguaNigerNigeriaNorth AmericaNorwayOECD membersOmanOther small statesPacific island small statesPakistanPalauPanamaPapua New GuineaParaguayPeruPhilippinesPolandPortugalPost-demographic dividendPre-demographic dividendQatarRomaniaRussian FederationRwandaSamoaSao Tome and PrincipeSaudi ArabiaSenegalSerbiaSeychellesSierra LeoneSingaporeSint Maarten (Dutch part)Slovak RepublicSloveniaSmall statesSolomon IslandsSouth AfricaSouth AsiaSouth Asia (IDA & IBRD)South SudanSpainSri LankaSt. Kitts and NevisSt. LuciaSt. Vincent and the GrenadinesSub-Saharan Africa Sub-Saharan Africa (excluding high income)Sub-Saharan Africa (IDA & IBRD countries)SudanSurinameSwazilandSwedenSwitzerlandSyrian Arab RepublicTajikistanTanzaniaThailandTimor-LesteTogoTongaTrinidad and TobagoTunisiaTurkeyTuvaluUgandaUkraineUnited KingdomUnited StatesUpper middle incomeUruguayVanuatuVenezuela, RBWest Bank and GazaWorldYemen, Rep.ZambiaZimbabwe línea de tiempo (timeline):
En esta escala de tiempo se presenta un gráfico de 1977 y 2016 de Germany. Los datos de 1976 están ausentes. El número de observaciones reales por fecha: 40.
Fuente (nombre):
Indicadores del desarrollo mundial
Fuente (organización):
International Monetary Fund, Balance of Payments Statistics Yearbook and data files.
Categorías:
Economy & Growth, Private Sector, Trade
Se ha actualizado:
23 abr 2017 año
Los indicadores de los cambios de valor en los últimos años
Mínimo:
0.524
1 ene 1977 año
Máximo:
7.907
1 ene 2015 año
A la fecha de observación
Valor
Cambio absoluto
El cambio con respecto al valor anterior
1 ene 1977 año
0.524
+0.524
0.0%
1 ene 1978 año
0.526
+0.002
0.43%
1 ene 1979 año
0.542
+0.016
3.05%
1 ene 1980 año
0.541
-0.001
-0.26%
1 ene 1981 año
0.869
+0.329
60.8%
1 ene 1982 año
0.804
-0.066
-7.54%
1 ene 1983 año
0.726
-0.077
-9.62%
1 ene 1984 año
0.823
+0.097
13.3%
1 ene 1985 año
0.94
+0.117
14.25%
1 ene 1986 año
1.051
+0.11
11.74%
1 ene 1987 año
1.224
+0.173
16.48%
1 ene 1988 año
1.257
+0.033
2.7%
1 ene 1989 año
1.451
+0.193
15.39%
1 ene 1990 año
1.233
-0.218
-15.0%
1 ene 1991 año
0.965
-0.268
-21.77%
1 ene 1992 año
2.396
+1.431
148.38%
1 ene 1993 año
2.629
+0.233
9.74%
1 ene 1994 año
2.883
+0.254
9.66%
1 ene 1995 año
2.645
-0.238
-8.26%
1 ene 1996 año
2.775
+0.13
4.9%
1 ene 1997 año
3.38
+0.605
21.81%
1 ene 1998 año
3.743
+0.363
10.74%
1 ene 1999 año
3.666
-0.077
-2.05%
1 ene 2000 año
4.425
+0.759
20.7%
1 ene 2001 año
3.556
-0.869
-19.65%
1 ene 2002 año
3.71
+0.154
4.34%
1 ene 2003 año
3.792
+0.081
2.19%
1 ene 2004 año
4.003
+0.212
5.58%
1 ene 2005 año
4.817
+0.814
20.34%
1 ene 2006 año
5.083
+0.266
5.53%
1 ene 2007 año
5.629
+0.546
10.74%
1 ene 2008 año
6.469
+0.84
14.92%
1 ene 2009 año
5.974
-0.495
-7.65%
1 ene 2010 año
6.056
+0.082
1.37%
1 ene 2011 año
5.693
-0.363
-6.0%
1 ene 2012 año
6.223
+0.53
9.3%
1 ene 2013 año
6.031
-0.192
-3.08%
1 ene 2014 año
5.815
-0.216
-3.59%
1 ene 2015 año
7.907
+2.092
35.98%
1 ene 2016 año
7.859
-0.048
-0.6%
Ranking de los países por los datos estadísticos actuales


Comentarios: