29
/es/
es
AIzaSyAYiBZKx7MnpbEhh9jyipgxe19OcubqV5w
April 1, 2024
121071
Dominica
DMA
true
2
1
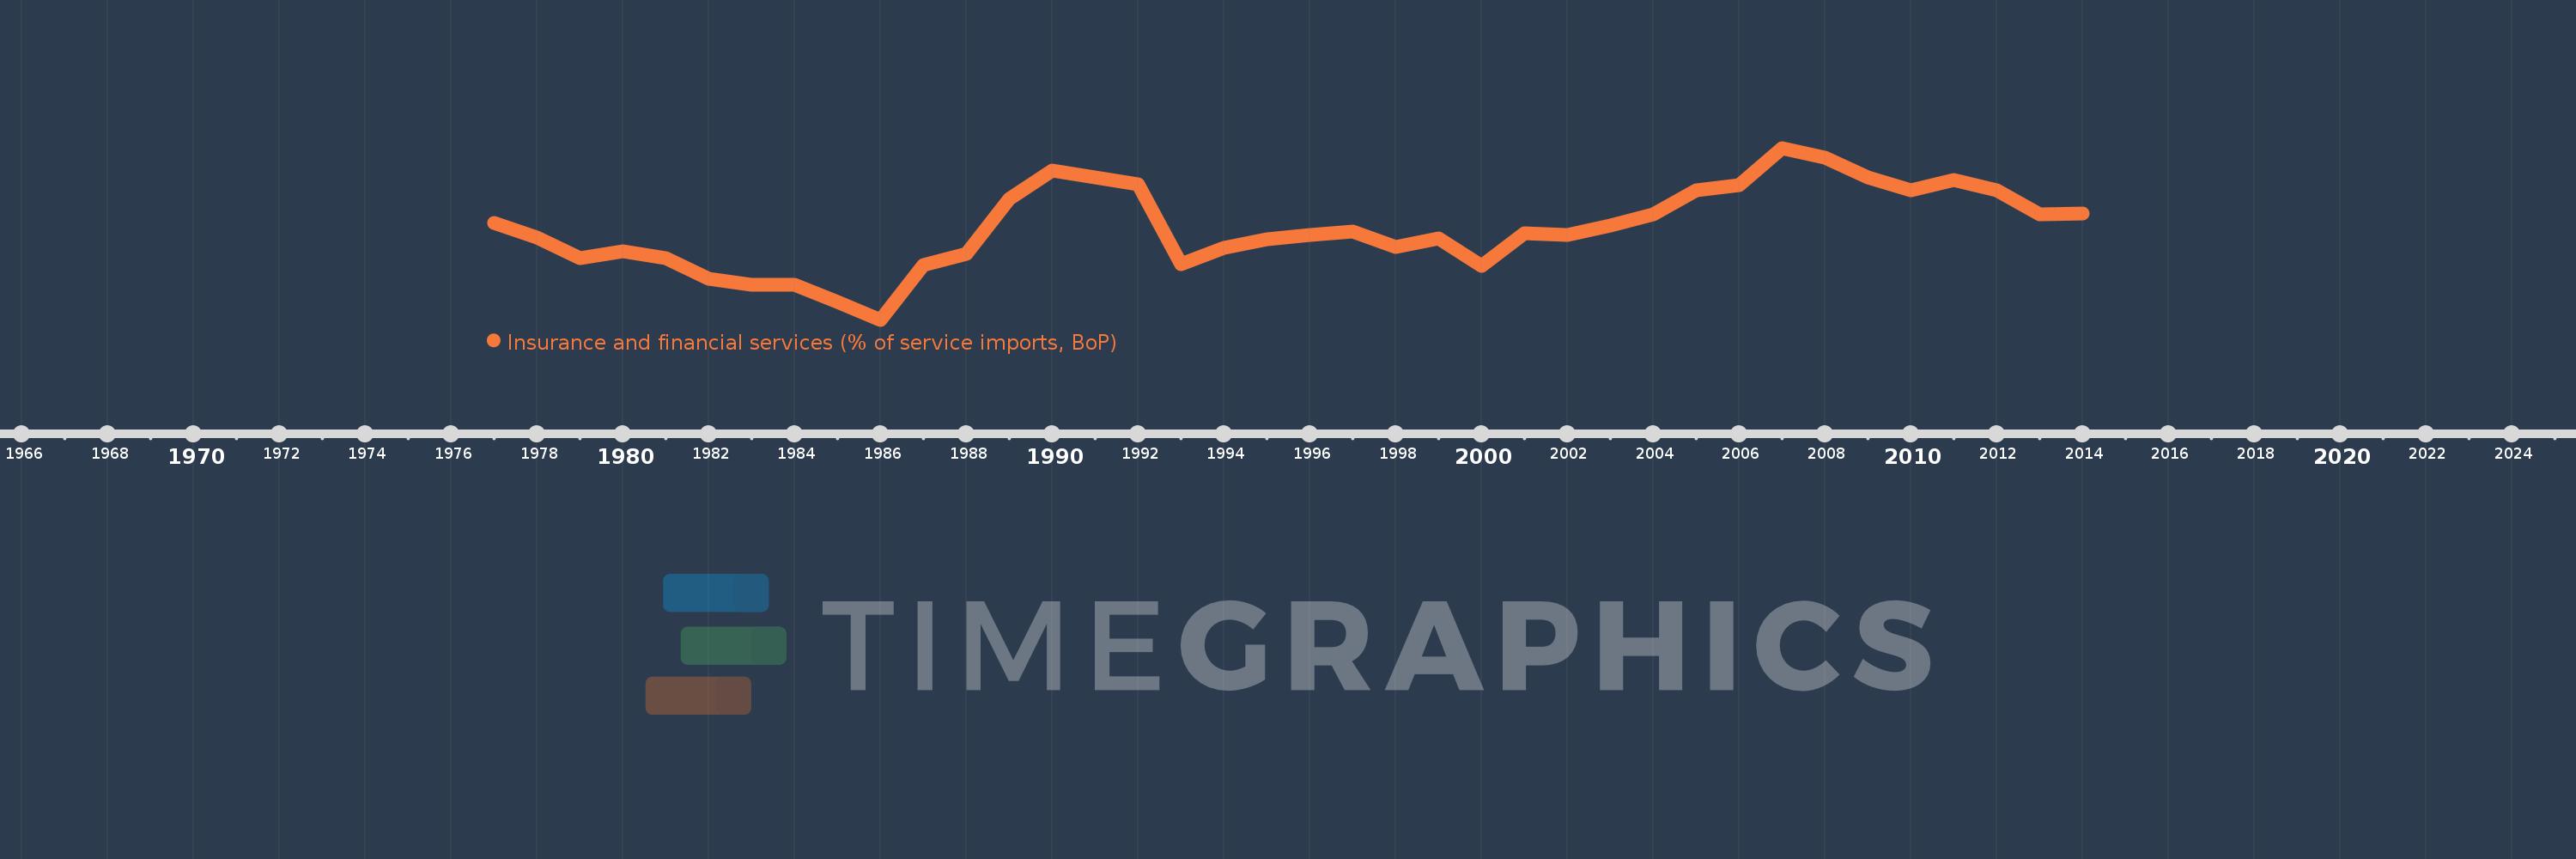
Insurance and financial services (% of service imports, BoP)
2014,2013,2012,2011,2010,2009,2008,2007,2006,2005,2004,2003,2002,2001,2000,1999,1998,1997,1996,1995,1994,1993,1992,1991,1990,1989,1988,1987,1986,1985,1984,1983,1982,1981,1980,1979,1978,1977
Estas estadísticas en otros países:
AfghanistanAlbaniaAlgeriaAngolaAntigua and BarbudaArab WorldArgentinaArmeniaArubaAustraliaAustriaAzerbaijanBahamas, TheBahrainBangladeshBarbadosBelarusBelgiumBelizeBeninBermudaBhutanBoliviaBosnia and HerzegovinaBotswanaBrazilBrunei DarussalamBulgariaBurkina FasoBurundiCabo VerdeCambodiaCameroonCanadaCaribbean small statesCentral African RepublicCentral Europe and the BalticsChadChileChinaColombiaComorosCongo, Dem. Rep.Congo, Rep.Costa RicaCote d'IvoireCroatiaCuracaoCyprusCzech RepublicDenmarkDjiboutiDominicaDominican RepublicEarly-demographic dividendEast Asia & PacificEast Asia & Pacific (excluding high income)East Asia & Pacific (IDA & IBRD countries)EcuadorEgypt, Arab Rep.El SalvadorEquatorial GuineaEritreaEstoniaEthiopiaEuro areaEurope & Central AsiaEurope & Central Asia (excluding high income)Europe & Central Asia (IDA & IBRD countries)European UnionFaroe IslandsFijiFinlandFragile and conflict affected situationsFranceFrench PolynesiaGabonGambia, TheGeorgiaGermanyGhanaGreeceGrenadaGuatemalaGuineaGuinea-BissauGuyanaHaitiHeavily indebted poor countries (HIPC)High incomeHondurasHong Kong SAR, ChinaHungaryIBRD onlyIcelandIDA & IBRD totalIDA onlyIDA totalIndiaIndonesiaIran, Islamic Rep.IraqIrelandIsraelItalyJamaicaJapanJordanKazakhstanKenyaKiribatiKorea, Rep.KosovoKuwaitKyrgyz RepublicLao PDRLate-demographic dividendLatin America & Caribbean Latin America & Caribbean (excluding high income)Latin America & the Caribbean (IDA & IBRD countries)LatviaLeast developed countries: UN classificationLebanonLesothoLiberiaLibyaLithuaniaLow & middle incomeLow incomeLower middle incomeLuxembourgMacao SAR, ChinaMacedonia, FYRMadagascarMalawiMalaysiaMaldivesMaliMaltaMarshall IslandsMauritaniaMauritiusMexicoMicronesia, Fed. Sts.Middle East & North AfricaMiddle East & North Africa (excluding high income)Middle East & North Africa (IDA & IBRD countries)Middle incomeMoldovaMongoliaMontenegroMoroccoMozambiqueMyanmarNamibiaNepalNetherlandsNew CaledoniaNew ZealandNicaraguaNigerNigeriaNorth AmericaNorwayOECD membersOmanOther small statesPacific island small statesPakistanPalauPanamaPapua New GuineaParaguayPeruPhilippinesPolandPortugalPost-demographic dividendPre-demographic dividendQatarRomaniaRussian FederationRwandaSamoaSao Tome and PrincipeSaudi ArabiaSenegalSerbiaSeychellesSierra LeoneSingaporeSint Maarten (Dutch part)Slovak RepublicSloveniaSmall statesSolomon IslandsSouth AfricaSouth AsiaSouth Asia (IDA & IBRD)South SudanSpainSri LankaSt. Kitts and NevisSt. LuciaSt. Vincent and the GrenadinesSub-Saharan Africa Sub-Saharan Africa (excluding high income)Sub-Saharan Africa (IDA & IBRD countries)SudanSurinameSwazilandSwedenSwitzerlandSyrian Arab RepublicTajikistanTanzaniaThailandTimor-LesteTogoTongaTrinidad and TobagoTunisiaTurkeyTuvaluUgandaUkraineUnited KingdomUnited StatesUpper middle incomeUruguayVanuatuVenezuela, RBWest Bank and GazaWorldYemen, Rep.ZambiaZimbabwe línea de tiempo (timeline):
En esta escala de tiempo se presenta un gráfico de 1977 y 2014 de Dominica. Los datos de 1976 están ausentes. El número de observaciones reales por fecha: 38.
Fuente (nombre):
Indicadores del desarrollo mundial
Fuente (organización):
International Monetary Fund, Balance of Payments Statistics Yearbook and data files.
Categorías:
Economy & Growth, Private Sector, Trade
Se ha actualizado:
23 abr 2017 año
Los indicadores de los cambios de valor en los últimos años
Mínimo:
4.407
1 ene 1986 año
Máximo:
13.393
1 ene 2007 año
A la fecha de observación
Valor
Cambio absoluto
El cambio con respecto al valor anterior
1 ene 1977 año
9.456
+9.456
0.0%
1 ene 1978 año
8.691
-0.765
-8.09%
1 ene 1979 año
7.642
-1.05
-12.08%
1 ene 1980 año
7.992
+0.35
4.58%
1 ene 1981 año
7.634
-0.357
-4.47%
1 ene 1982 año
6.533
-1.101
-14.43%
1 ene 1983 año
6.244
-0.289
-4.42%
1 ene 1984 año
6.224
-0.02
-0.32%
1 ene 1985 año
5.358
-0.866
-13.92%
1 ene 1986 año
4.407
-0.951
-17.75%
1 ene 1987 año
7.255
+2.848
64.64%
1 ene 1988 año
7.87
+0.615
8.47%
1 ene 1989 año
10.729
+2.859
36.33%
1 ene 1990 año
12.213
+1.484
13.83%
1 ene 1991 año
11.864
-0.349
-2.86%
1 ene 1992 año
11.47
-0.394
-3.32%
1 ene 1993 año
7.335
-4.135
-36.05%
1 ene 1994 año
8.182
+0.847
11.55%
1 ene 1995 año
8.621
+0.438
5.35%
1 ene 1996 año
8.822
+0.201
2.33%
1 ene 1997 año
9.014
+0.192
2.18%
1 ene 1998 año
8.223
-0.791
-8.78%
1 ene 1999 año
8.684
+0.461
5.61%
1 ene 2000 año
7.21
-1.474
-16.98%
1 ene 2001 año
8.934
+1.725
23.92%
1 ene 2002 año
8.847
-0.088
-0.98%
1 ene 2003 año
9.324
+0.477
5.39%
1 ene 2004 año
9.908
+0.584
6.26%
1 ene 2005 año
11.157
+1.249
12.61%
1 ene 2006 año
11.439
+0.282
2.53%
1 ene 2007 año
13.393
+1.954
17.08%
1 ene 2008 año
12.868
-0.525
-3.92%
1 ene 2009 año
11.859
-1.009
-7.84%
1 ene 2010 año
11.185
-0.674
-5.68%
1 ene 2011 año
11.739
+0.553
4.95%
1 ene 2012 año
11.197
-0.541
-4.61%
1 ene 2013 año
9.908
-1.29
-11.52%
1 ene 2014 año
9.955
+0.048
0.48%
Ranking de los países por los datos estadísticos actuales


Comentarios: