29
/es/
es
AIzaSyAYiBZKx7MnpbEhh9jyipgxe19OcubqV5w
April 1, 2024
233730
Sao Tome and Principe
STP
true
2
1
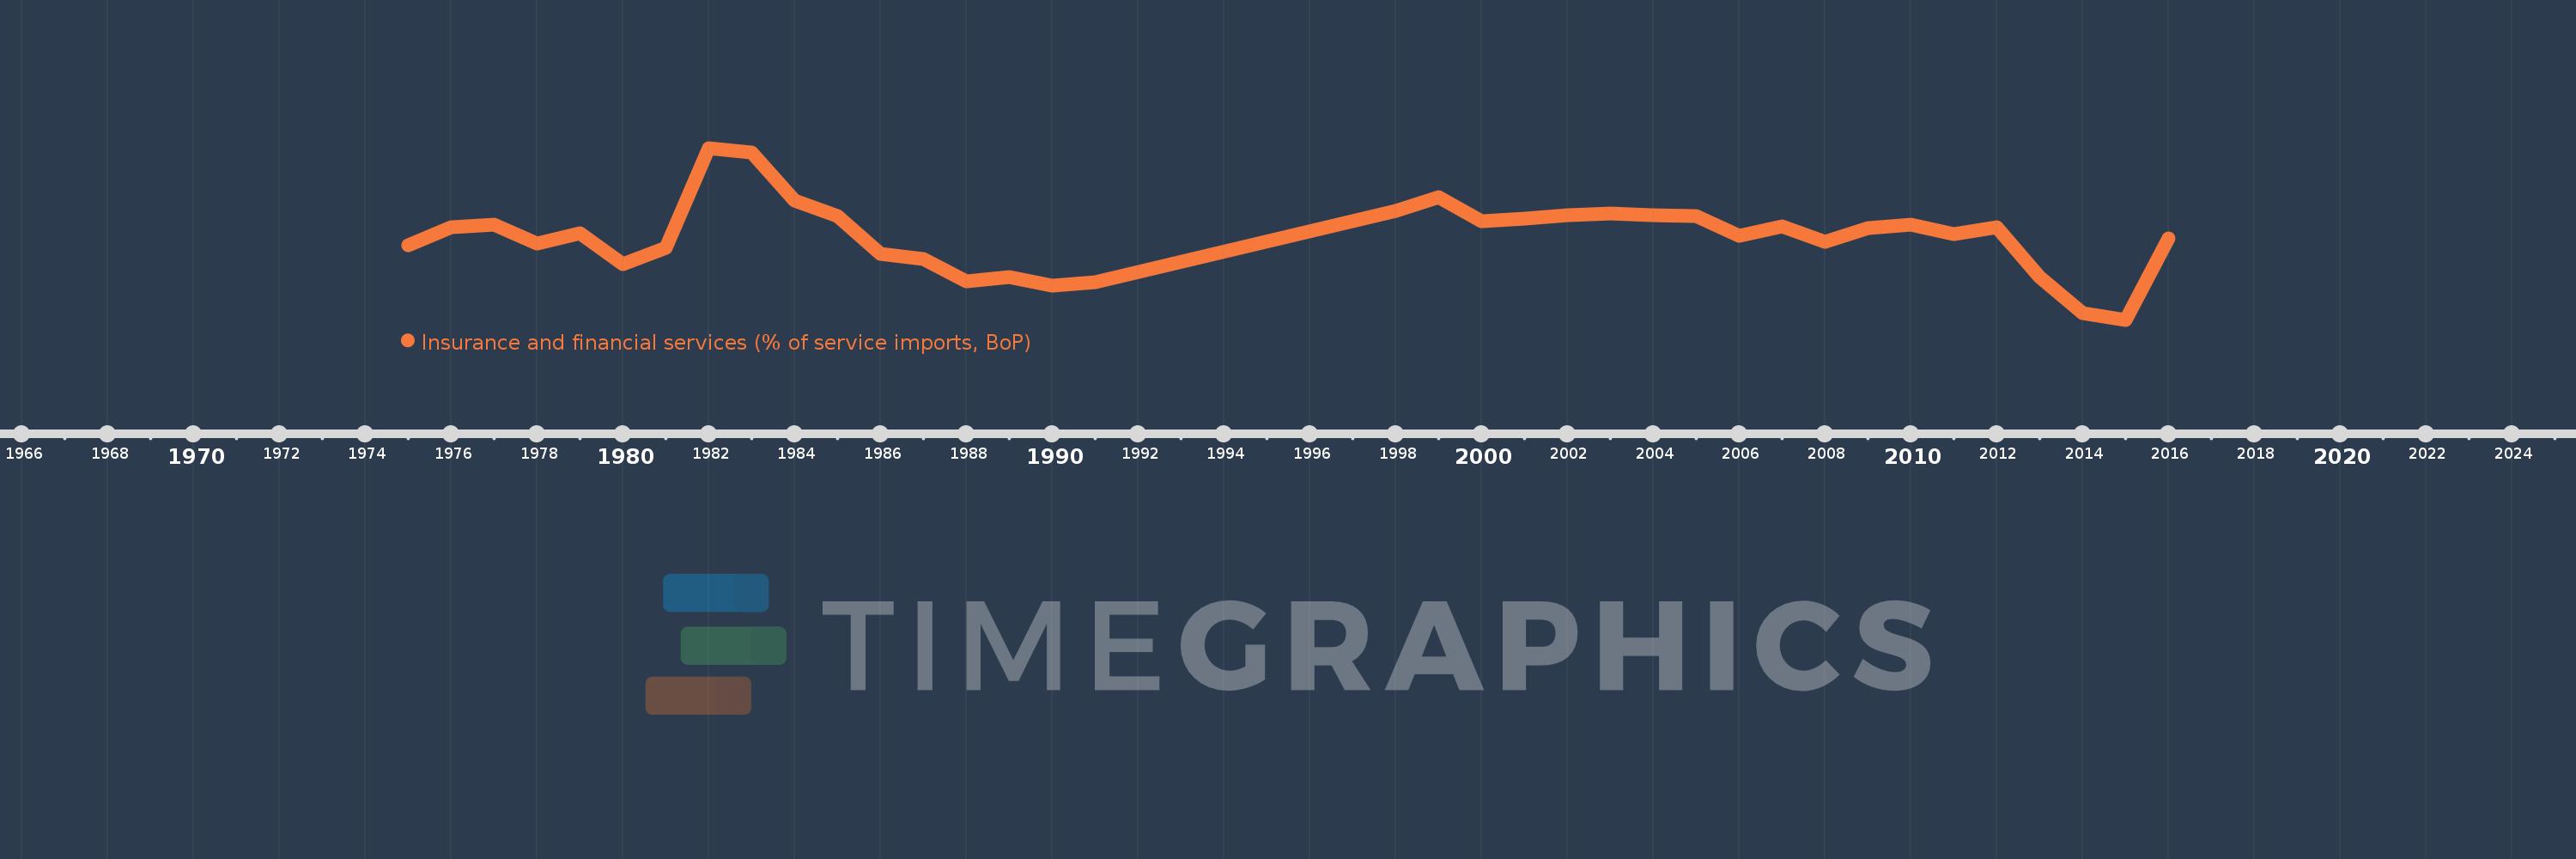
Insurance and financial services (% of service imports, BoP)
2016,2015,2014,2013,2012,2011,2010,2009,2008,2007,2006,2005,2004,2003,2002,2001,2000,1999,1998,1991,1990,1989,1988,1987,1986,1985,1984,1983,1982,1981,1980,1979,1978,1977,1976,1975
Estas estadísticas en otros países:
AfghanistanAlbaniaAlgeriaAngolaAntigua and BarbudaArab WorldArgentinaArmeniaArubaAustraliaAustriaAzerbaijanBahamas, TheBahrainBangladeshBarbadosBelarusBelgiumBelizeBeninBermudaBhutanBoliviaBosnia and HerzegovinaBotswanaBrazilBrunei DarussalamBulgariaBurkina FasoBurundiCabo VerdeCambodiaCameroonCanadaCaribbean small statesCentral African RepublicCentral Europe and the BalticsChadChileChinaColombiaComorosCongo, Dem. Rep.Congo, Rep.Costa RicaCote d'IvoireCroatiaCuracaoCyprusCzech RepublicDenmarkDjiboutiDominicaDominican RepublicEarly-demographic dividendEast Asia & PacificEast Asia & Pacific (excluding high income)East Asia & Pacific (IDA & IBRD countries)EcuadorEgypt, Arab Rep.El SalvadorEquatorial GuineaEritreaEstoniaEthiopiaEuro areaEurope & Central AsiaEurope & Central Asia (excluding high income)Europe & Central Asia (IDA & IBRD countries)European UnionFaroe IslandsFijiFinlandFragile and conflict affected situationsFranceFrench PolynesiaGabonGambia, TheGeorgiaGermanyGhanaGreeceGrenadaGuatemalaGuineaGuinea-BissauGuyanaHaitiHeavily indebted poor countries (HIPC)High incomeHondurasHong Kong SAR, ChinaHungaryIBRD onlyIcelandIDA & IBRD totalIDA onlyIDA totalIndiaIndonesiaIran, Islamic Rep.IraqIrelandIsraelItalyJamaicaJapanJordanKazakhstanKenyaKiribatiKorea, Rep.KosovoKuwaitKyrgyz RepublicLao PDRLate-demographic dividendLatin America & Caribbean Latin America & Caribbean (excluding high income)Latin America & the Caribbean (IDA & IBRD countries)LatviaLeast developed countries: UN classificationLebanonLesothoLiberiaLibyaLithuaniaLow & middle incomeLow incomeLower middle incomeLuxembourgMacao SAR, ChinaMacedonia, FYRMadagascarMalawiMalaysiaMaldivesMaliMaltaMarshall IslandsMauritaniaMauritiusMexicoMicronesia, Fed. Sts.Middle East & North AfricaMiddle East & North Africa (excluding high income)Middle East & North Africa (IDA & IBRD countries)Middle incomeMoldovaMongoliaMontenegroMoroccoMozambiqueMyanmarNamibiaNepalNetherlandsNew CaledoniaNew ZealandNicaraguaNigerNigeriaNorth AmericaNorwayOECD membersOmanOther small statesPacific island small statesPakistanPalauPanamaPapua New GuineaParaguayPeruPhilippinesPolandPortugalPost-demographic dividendPre-demographic dividendQatarRomaniaRussian FederationRwandaSamoaSao Tome and PrincipeSaudi ArabiaSenegalSerbiaSeychellesSierra LeoneSingaporeSint Maarten (Dutch part)Slovak RepublicSloveniaSmall statesSolomon IslandsSouth AfricaSouth AsiaSouth Asia (IDA & IBRD)South SudanSpainSri LankaSt. Kitts and NevisSt. LuciaSt. Vincent and the GrenadinesSub-Saharan Africa Sub-Saharan Africa (excluding high income)Sub-Saharan Africa (IDA & IBRD countries)SudanSurinameSwazilandSwedenSwitzerlandSyrian Arab RepublicTajikistanTanzaniaThailandTimor-LesteTogoTongaTrinidad and TobagoTunisiaTurkeyTuvaluUgandaUkraineUnited KingdomUnited StatesUpper middle incomeUruguayVanuatuVenezuela, RBWest Bank and GazaWorldYemen, Rep.ZambiaZimbabwe línea de tiempo (timeline):
En esta escala de tiempo se presenta un gráfico de 1975 y 2016 de Sao Tome and Principe. Los datos de 1974 están ausentes. El número de observaciones reales por fecha: 36.
Fuente (nombre):
Indicadores del desarrollo mundial
Fuente (organización):
International Monetary Fund, Balance of Payments Statistics Yearbook and data files.
Categorías:
Economy & Growth, Private Sector, Trade
Se ha actualizado:
23 abr 2017 año
Los indicadores de los cambios de valor en los últimos años
Mínimo:
1.259
1 ene 2015 año
Máximo:
11.07
1 ene 1982 año
A la fecha de observación
Valor
Cambio absoluto
El cambio con respecto al valor anterior
1 ene 1975 año
5.514
+5.514
0.0%
1 ene 1976 año
6.543
+1.028
18.65%
1 ene 1977 año
6.685
+0.142
2.17%
1 ene 1978 año
5.631
-1.054
-15.76%
1 ene 1979 año
6.199
+0.567
10.07%
1 ene 1980 año
4.409
-1.79
-28.88%
1 ene 1981 año
5.346
+0.938
21.27%
1 ene 1982 año
11.07
+5.723
107.05%
1 ene 1983 año
10.812
-0.257
-2.33%
1 ene 1984 año
8.078
-2.734
-25.29%
1 ene 1985 año
7.171
-0.907
-11.23%
1 ene 1986 año
5.031
-2.14
-29.84%
1 ene 1987 año
4.735
-0.296
-5.89%
1 ene 1988 año
3.457
-1.278
-26.99%
1 ene 1989 año
3.676
+0.219
6.34%
1 ene 1990 año
3.192
-0.483
-13.15%
1 ene 1991 año
3.404
+0.211
6.62%
1 ene 1998 año
7.486
+4.082
119.95%
1 ene 1999 año
8.273
+0.787
10.51%
1 ene 2000 año
6.885
-1.388
-16.78%
1 ene 2001 año
7.041
+0.156
2.27%
1 ene 2002 año
7.246
+0.205
2.92%
1 ene 2003 año
7.348
+0.102
1.4%
1 ene 2004 año
7.249
-0.099
-1.35%
1 ene 2005 año
7.191
-0.058
-0.8%
1 ene 2006 año
6.064
-1.126
-15.66%
1 ene 2007 año
6.613
+0.549
9.05%
1 ene 2008 año
5.722
-0.891
-13.48%
1 ene 2009 año
6.511
+0.789
13.78%
1 ene 2010 año
6.677
+0.166
2.55%
1 ene 2011 año
6.127
-0.549
-8.23%
1 ene 2012 año
6.551
+0.424
6.92%
1 ene 2013 año
3.714
-2.837
-43.3%
1 ene 2014 año
1.646
-2.069
-55.69%
1 ene 2015 año
1.259
-0.387
-23.52%
1 ene 2016 año
5.885
+4.626
367.53%
Ranking de los países por los datos estadísticos actuales


Comentarios: