29
/es/
es
AIzaSyAYiBZKx7MnpbEhh9jyipgxe19OcubqV5w
April 1, 2024
42068
Latin America & Caribbean (excluding high income)
LAC
false
2
1
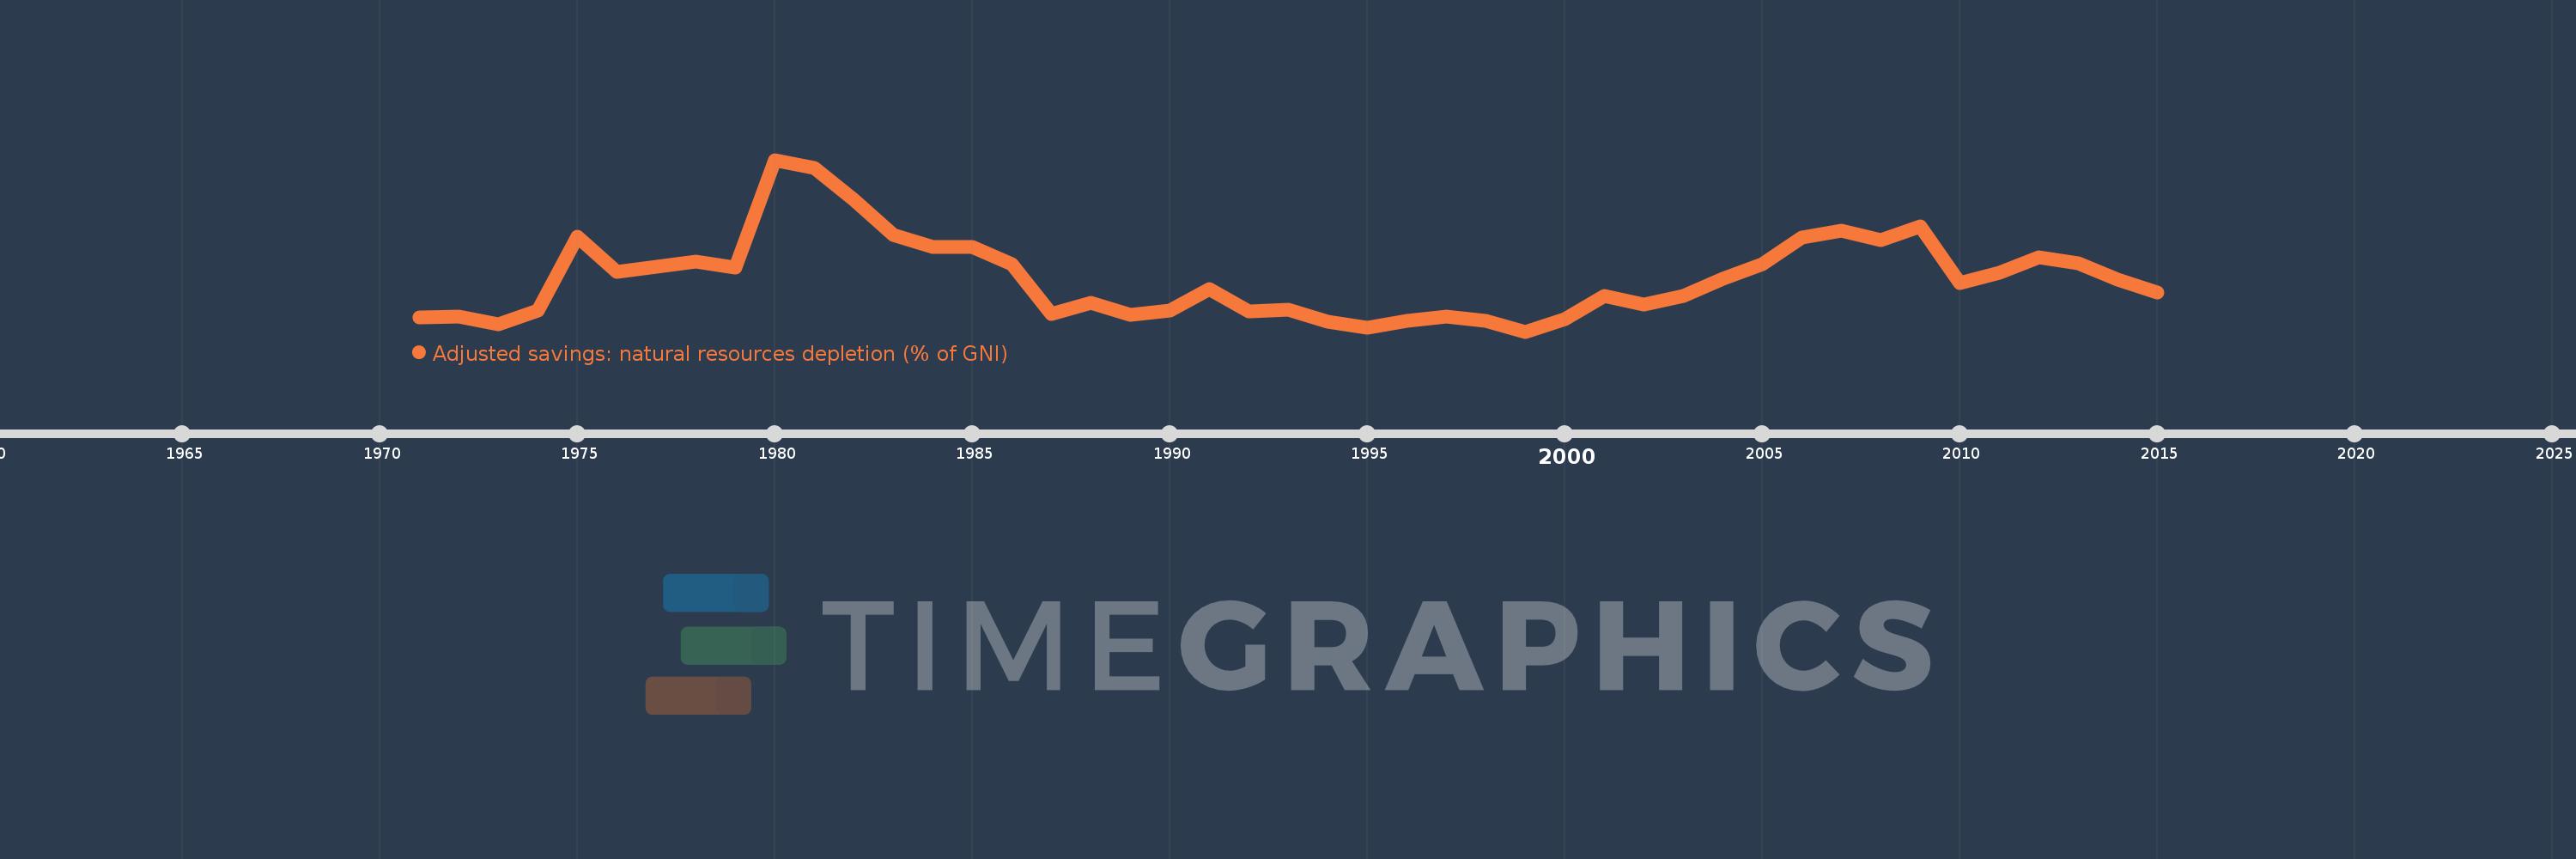
Adjusted savings: natural resources depletion (% of GNI)
2015,2014,2013,2012,2011,2010,2009,2008,2007,2006,2005,2004,2003,2002,2001,2000,1999,1998,1997,1996,1995,1994,1993,1992,1991,1990,1989,1988,1987,1986,1985,1984,1983,1982,1981,1980,1979,1978,1977,1976,1975,1974,1973,1972,1971
Estas estadísticas en otros países:
AfghanistanAlbaniaAlgeriaAngolaArab WorldArgentinaArmeniaAustraliaAustriaAzerbaijanBahamas, TheBahrainBangladeshBarbadosBelarusBelgiumBelizeBeninBhutanBoliviaBotswanaBrazilBrunei DarussalamBulgariaBurkina FasoBurundiCabo VerdeCambodiaCameroonCanadaCaribbean small statesCentral African RepublicCentral Europe and the BalticsChadChileChinaColombiaComorosCongo, Dem. Rep.Congo, Rep.Costa RicaCote d'IvoireCroatiaCubaCyprusCzech RepublicDenmarkDjiboutiDominicaDominican RepublicEarly-demographic dividendEast Asia & PacificEast Asia & Pacific (excluding high income)East Asia & Pacific (IDA & IBRD countries)EcuadorEgypt, Arab Rep.El SalvadorEquatorial GuineaEritreaEstoniaEthiopiaEuro areaEurope & Central AsiaEurope & Central Asia (excluding high income)Europe & Central Asia (IDA & IBRD countries)European UnionFijiFinlandFragile and conflict affected situationsFranceFrench PolynesiaGabonGambia, TheGeorgiaGermanyGhanaGreeceGuatemalaGuineaGuinea-BissauGuyanaHaitiHeavily indebted poor countries (HIPC)High incomeHondurasHong Kong SAR, ChinaHungaryIBRD onlyIcelandIDA & IBRD totalIDA blendIDA onlyIDA totalIndiaIndonesiaIran, Islamic Rep.IraqIrelandIsraelItalyJamaicaJapanJordanKazakhstanKenyaKiribatiKorea, Rep.KuwaitKyrgyz RepublicLao PDRLate-demographic dividendLatin America & Caribbean Latin America & Caribbean (excluding high income)Latin America & the Caribbean (IDA & IBRD countries)LatviaLeast developed countries: UN classificationLebanonLesothoLiberiaLibyaLithuaniaLow & middle incomeLow incomeLower middle incomeLuxembourgMacedonia, FYRMadagascarMalawiMalaysiaMaldivesMaliMauritaniaMauritiusMexicoMicronesia, Fed. Sts.Middle East & North AfricaMiddle East & North Africa (excluding high income)Middle East & North Africa (IDA & IBRD countries)Middle incomeMoldovaMongoliaMoroccoMozambiqueMyanmarNamibiaNepalNetherlandsNew CaledoniaNew ZealandNicaraguaNigerNigeriaNorth AmericaNorwayOECD membersOmanOther small statesPacific island small statesPakistanPanamaPapua New GuineaParaguayPeruPhilippinesPolandPortugalPost-demographic dividendPre-demographic dividendQatarRomaniaRussian FederationRwandaSamoaSao Tome and PrincipeSaudi ArabiaSenegalSeychellesSierra LeoneSingaporeSlovak RepublicSloveniaSmall statesSolomon IslandsSomaliaSouth AfricaSouth AsiaSouth Asia (IDA & IBRD)SpainSri LankaSt. LuciaSt. Vincent and the GrenadinesSub-Saharan Africa Sub-Saharan Africa (excluding high income)Sub-Saharan Africa (IDA & IBRD countries)SudanSurinameSwazilandSwedenSwitzerlandSyrian Arab RepublicTajikistanTanzaniaThailandTogoTongaTrinidad and TobagoTunisiaTurkeyTurkmenistanUgandaUkraineUnited Arab EmiratesUnited KingdomUnited StatesUpper middle incomeUruguayUzbekistanVanuatuVenezuela, RBVietnamWorldYemen, Rep.ZambiaZimbabwe línea de tiempo (timeline):
En esta escala de tiempo se presenta un gráfico de 1971 y 2015 de Latin America & Caribbean (excluding high income). Los datos de 1970 están ausentes. El número de observaciones reales por fecha: 45.
Fuente (nombre):
Indicadores del desarrollo mundial
Fuente (organización):
World Bank staff estimates based on sources and methods in World Bank's "The Changing Wealth of Nations: Measuring Sustainable Development in the New Millennium" (2011).
Categorías:
Economy & Growth, Energy & Mining
Se ha actualizado:
23 abr 2017 año
Los indicadores de los cambios de valor en los últimos años
Mínimo:
1.691
1 ene 1999 año
Máximo:
10.415
1 ene 1980 año
A la fecha de observación
Valor
Cambio absoluto
El cambio con respecto al valor anterior
1 ene 1971 año
2.429
+2.429
0.0%
1 ene 1972 año
2.436
+0.007
0.3%
1 ene 1973 año
2.079
-0.357
-14.65%
1 ene 1974 año
2.77
+0.691
33.21%
1 ene 1975 año
6.504
+3.734
134.79%
1 ene 1976 año
4.722
-1.782
-27.39%
1 ene 1977 año
5.005
+0.283
5.99%
1 ene 1978 año
5.231
+0.226
4.52%
1 ene 1979 año
4.934
-0.297
-5.69%
1 ene 1980 año
10.415
+5.481
111.09%
1 ene 1981 año
10.012
-0.403
-3.87%
1 ene 1982 año
8.367
-1.645
-16.43%
1 ene 1983 año
6.598
-1.769
-21.14%
1 ene 1984 año
6.004
-0.594
-9.01%
1 ene 1985 año
5.997
-0.007
-0.12%
1 ene 1986 año
5.113
-0.884
-14.74%
1 ene 1987 año
2.583
-2.53
-49.49%
1 ene 1988 año
3.146
+0.563
21.82%
1 ene 1989 año
2.521
-0.625
-19.87%
1 ene 1990 año
2.746
+0.225
8.92%
1 ene 1991 año
3.859
+1.113
40.54%
1 ene 1992 año
2.712
-1.147
-29.73%
1 ene 1993 año
2.796
+0.084
3.1%
1 ene 1994 año
2.208
-0.587
-21.01%
1 ene 1995 año
1.909
-0.299
-13.55%
1 ene 1996 año
2.226
+0.317
16.6%
1 ene 1997 año
2.457
+0.231
10.4%
1 ene 1998 año
2.234
-0.224
-9.11%
1 ene 1999 año
1.691
-0.543
-24.29%
1 ene 2000 año
2.31
+0.619
36.6%
1 ene 2001 año
3.509
+1.199
51.9%
1 ene 2002 año
3.085
-0.424
-12.09%
1 ene 2003 año
3.505
+0.42
13.63%
1 ene 2004 año
4.355
+0.85
24.26%
1 ene 2005 año
5.134
+0.779
17.89%
1 ene 2006 año
6.459
+1.325
25.8%
1 ene 2007 año
6.797
+0.338
5.24%
1 ene 2008 año
6.321
-0.477
-7.01%
1 ene 2009 año
7.027
+0.706
11.18%
1 ene 2010 año
4.154
-2.873
-40.89%
1 ene 2011 año
4.668
+0.514
12.37%
1 ene 2012 año
5.479
+0.811
17.38%
1 ene 2013 año
5.156
-0.323
-5.9%
1 ene 2014 año
4.341
-0.815
-15.81%
1 ene 2015 año
3.694
-0.647
-14.91%
Ranking de los países por los datos estadísticos actuales


Comentarios: