29
/es/
es
AIzaSyAYiBZKx7MnpbEhh9jyipgxe19OcubqV5w
April 1, 2024
169602
Korea, Rep.
KOR
true
2
1
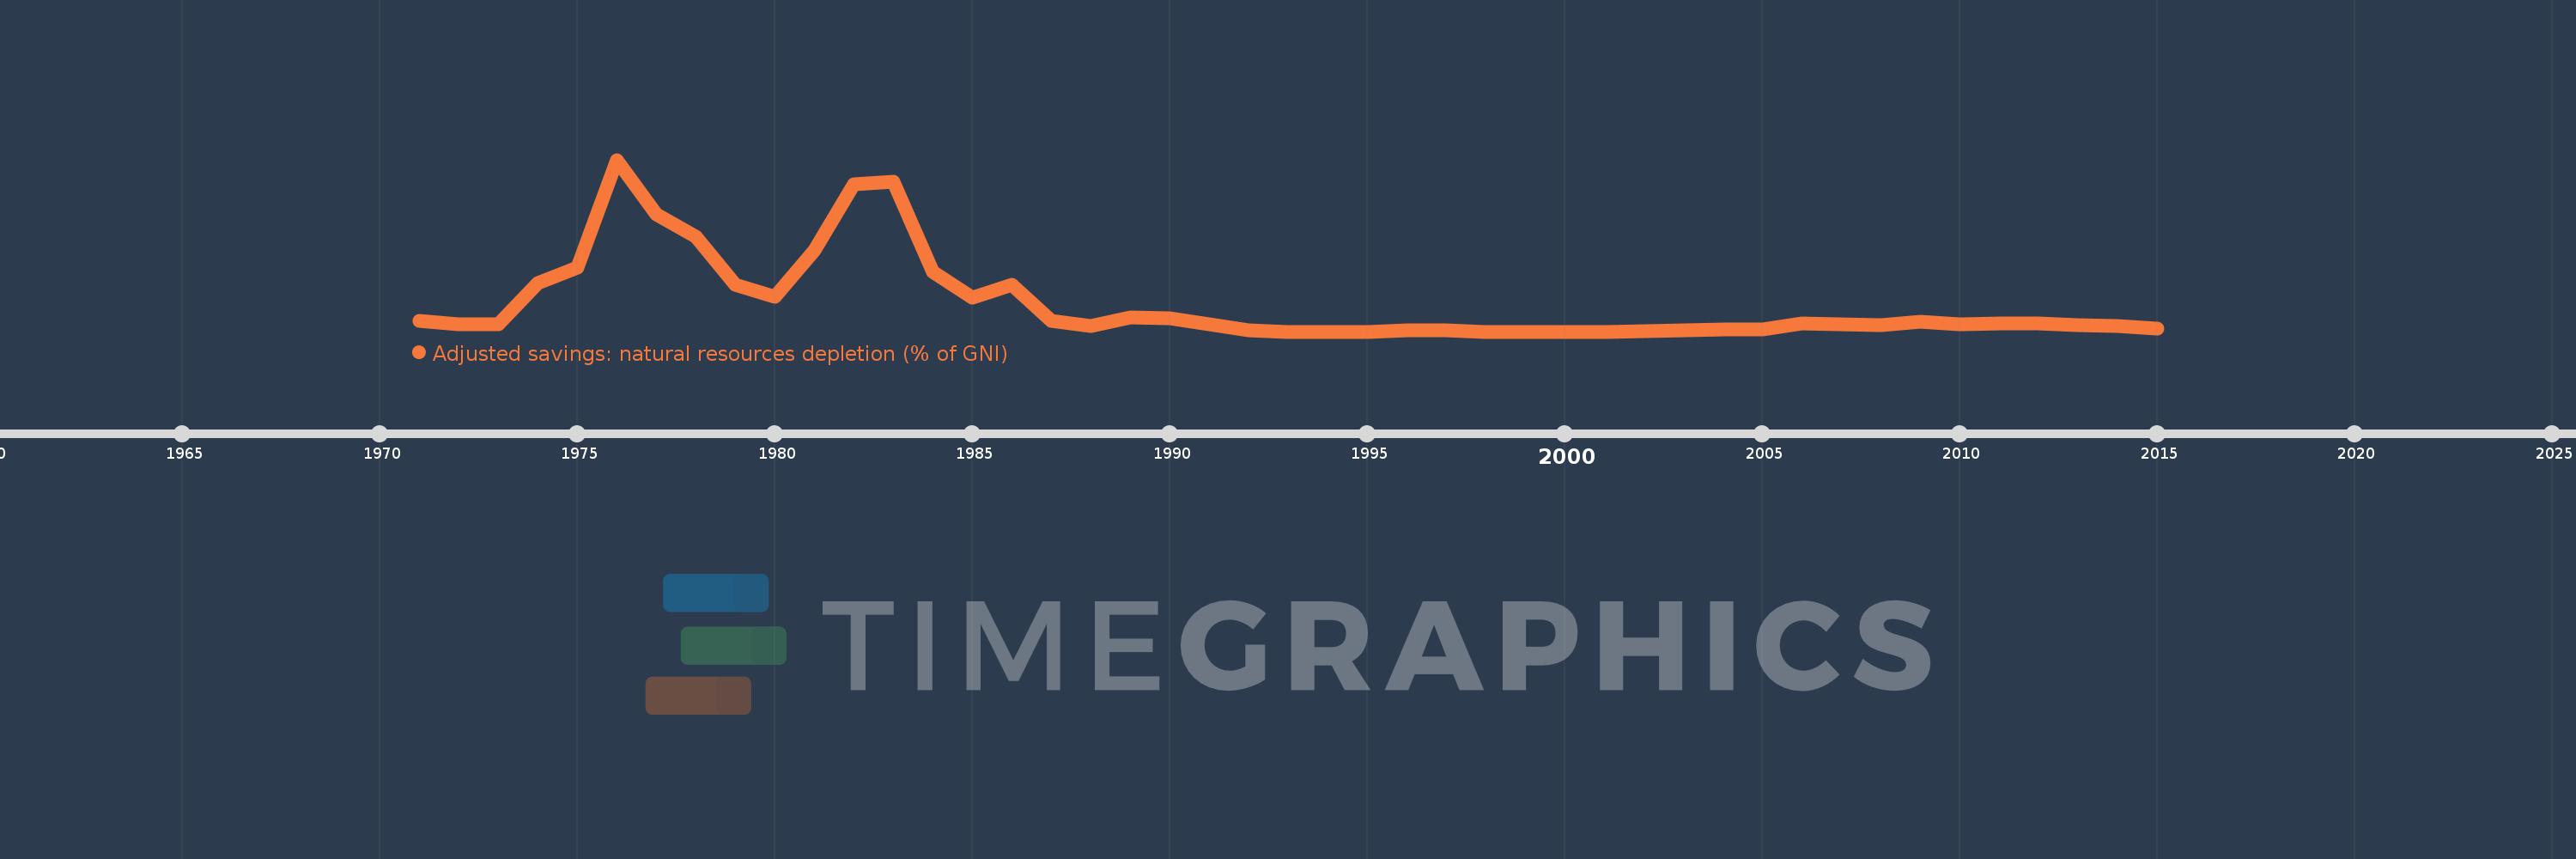
Adjusted savings: natural resources depletion (% of GNI)
2015,2014,2013,2012,2011,2010,2009,2008,2007,2006,2005,2004,2003,2002,2001,2000,1999,1998,1997,1996,1995,1994,1993,1992,1991,1990,1989,1988,1987,1986,1985,1984,1983,1982,1981,1980,1979,1978,1977,1976,1975,1974,1973,1972,1971
Estas estadísticas en otros países:
AfghanistanAlbaniaAlgeriaAngolaArab WorldArgentinaArmeniaAustraliaAustriaAzerbaijanBahamas, TheBahrainBangladeshBarbadosBelarusBelgiumBelizeBeninBhutanBoliviaBotswanaBrazilBrunei DarussalamBulgariaBurkina FasoBurundiCabo VerdeCambodiaCameroonCanadaCaribbean small statesCentral African RepublicCentral Europe and the BalticsChadChileChinaColombiaComorosCongo, Dem. Rep.Congo, Rep.Costa RicaCote d'IvoireCroatiaCubaCyprusCzech RepublicDenmarkDjiboutiDominicaDominican RepublicEarly-demographic dividendEast Asia & PacificEast Asia & Pacific (excluding high income)East Asia & Pacific (IDA & IBRD countries)EcuadorEgypt, Arab Rep.El SalvadorEquatorial GuineaEritreaEstoniaEthiopiaEuro areaEurope & Central AsiaEurope & Central Asia (excluding high income)Europe & Central Asia (IDA & IBRD countries)European UnionFijiFinlandFragile and conflict affected situationsFranceFrench PolynesiaGabonGambia, TheGeorgiaGermanyGhanaGreeceGuatemalaGuineaGuinea-BissauGuyanaHaitiHeavily indebted poor countries (HIPC)High incomeHondurasHong Kong SAR, ChinaHungaryIBRD onlyIcelandIDA & IBRD totalIDA blendIDA onlyIDA totalIndiaIndonesiaIran, Islamic Rep.IraqIrelandIsraelItalyJamaicaJapanJordanKazakhstanKenyaKiribatiKorea, Rep.KuwaitKyrgyz RepublicLao PDRLate-demographic dividendLatin America & Caribbean Latin America & Caribbean (excluding high income)Latin America & the Caribbean (IDA & IBRD countries)LatviaLeast developed countries: UN classificationLebanonLesothoLiberiaLibyaLithuaniaLow & middle incomeLow incomeLower middle incomeLuxembourgMacedonia, FYRMadagascarMalawiMalaysiaMaldivesMaliMauritaniaMauritiusMexicoMicronesia, Fed. Sts.Middle East & North AfricaMiddle East & North Africa (excluding high income)Middle East & North Africa (IDA & IBRD countries)Middle incomeMoldovaMongoliaMoroccoMozambiqueMyanmarNamibiaNepalNetherlandsNew CaledoniaNew ZealandNicaraguaNigerNigeriaNorth AmericaNorwayOECD membersOmanOther small statesPacific island small statesPakistanPanamaPapua New GuineaParaguayPeruPhilippinesPolandPortugalPost-demographic dividendPre-demographic dividendQatarRomaniaRussian FederationRwandaSamoaSao Tome and PrincipeSaudi ArabiaSenegalSeychellesSierra LeoneSingaporeSlovak RepublicSloveniaSmall statesSolomon IslandsSomaliaSouth AfricaSouth AsiaSouth Asia (IDA & IBRD)SpainSri LankaSt. LuciaSt. Vincent and the GrenadinesSub-Saharan Africa Sub-Saharan Africa (excluding high income)Sub-Saharan Africa (IDA & IBRD countries)SudanSurinameSwazilandSwedenSwitzerlandSyrian Arab RepublicTajikistanTanzaniaThailandTogoTongaTrinidad and TobagoTunisiaTurkeyTurkmenistanUgandaUkraineUnited Arab EmiratesUnited KingdomUnited StatesUpper middle incomeUruguayUzbekistanVanuatuVenezuela, RBVietnamWorldYemen, Rep.ZambiaZimbabwe línea de tiempo (timeline):
En esta escala de tiempo se presenta un gráfico de 1971 y 2015 de Korea, Rep.. Los datos de 1970 están ausentes. El número de observaciones reales por fecha: 45.
Fuente (nombre):
Indicadores del desarrollo mundial
Fuente (organización):
World Bank staff estimates based on sources and methods in World Bank's "The Changing Wealth of Nations: Measuring Sustainable Development in the New Millennium" (2011).
Categorías:
Economy & Growth, Energy & Mining
Se ha actualizado:
23 abr 2017 año
Los indicadores de los cambios de valor en los últimos años
Máximo:
0.342
1 ene 1976 año
A la fecha de observación
Valor
Cambio absoluto
El cambio con respecto al valor anterior
1 ene 1971 año
0.021
+0.021
0.0%
1 ene 1972 año
0.014
-0.006
-31.11%
1 ene 1973 año
0.014
0.0
-1.38%
1 ene 1974 año
0.097
+0.083
588.51%
1 ene 1975 año
0.128
+0.032
32.59%
1 ene 1976 año
0.342
+0.213
165.98%
1 ene 1977 año
0.234
-0.108
-31.61%
1 ene 1978 año
0.189
-0.045
-19.15%
1 ene 1979 año
0.094
-0.095
-50.05%
1 ene 1980 año
0.069
-0.025
-26.42%
1 ene 1981 año
0.161
+0.092
132.14%
1 ene 1982 año
0.294
+0.132
82.17%
1 ene 1983 año
0.299
+0.006
1.91%
1 ene 1984 año
0.118
-0.181
-60.48%
1 ene 1985 año
0.068
-0.051
-42.87%
1 ene 1986 año
0.093
+0.025
37.44%
1 ene 1987 año
0.021
-0.072
-77.23%
1 ene 1988 año
0.011
-0.01
-46.64%
1 ene 1989 año
0.028
+0.017
150.15%
1 ene 1990 año
0.027
-0.001
-2.94%
1 ene 1991 año
0.014
-0.014
-49.35%
1 ene 1992 año
0.002
-0.012
-86.48%
1 ene 1993 año
0.0
-0.002
-88.57%
1 ene 1994 año
0.0
0.0
-68.23%
1 ene 1995 año
0.0
+0.0
575.91%
1 ene 1996 año
0.002
+0.002
327.54%
1 ene 1997 año
0.003
+0.001
32.43%
1 ene 1998 año
0.0
-0.002
-89.36%
1 ene 1999 año
0.0
0.0
-42.75%
1 ene 2000 año
0.0
0.0
-100.0%
1 ene 2002 año
0.001
+0.001
3.13 mil%
1 ene 2003 año
0.003
+0.002
143.75%
1 ene 2004 año
0.005
+0.002
83.43%
1 ene 2005 año
0.004
-0.001
-24.63%
1 ene 2006 año
0.017
+0.013
311.3%
1 ene 2007 año
0.014
-0.003
-17.48%
1 ene 2008 año
0.012
-0.002
-13.58%
1 ene 2009 año
0.02
+0.008
64.11%
1 ene 2010 año
0.015
-0.005
-23.75%
1 ene 2011 año
0.016
+0.001
6.64%
1 ene 2012 año
0.017
+0.001
4.84%
1 ene 2013 año
0.012
-0.005
-31.43%
1 ene 2014 año
0.011
-0.001
-7.56%
1 ene 2015 año
0.006
-0.005
-46.02%
Ranking de los países por los datos estadísticos actuales


Comentarios: