29
/es/
es
AIzaSyAYiBZKx7MnpbEhh9jyipgxe19OcubqV5w
April 1, 2024
195134
Mexico
MEX
true
2
1
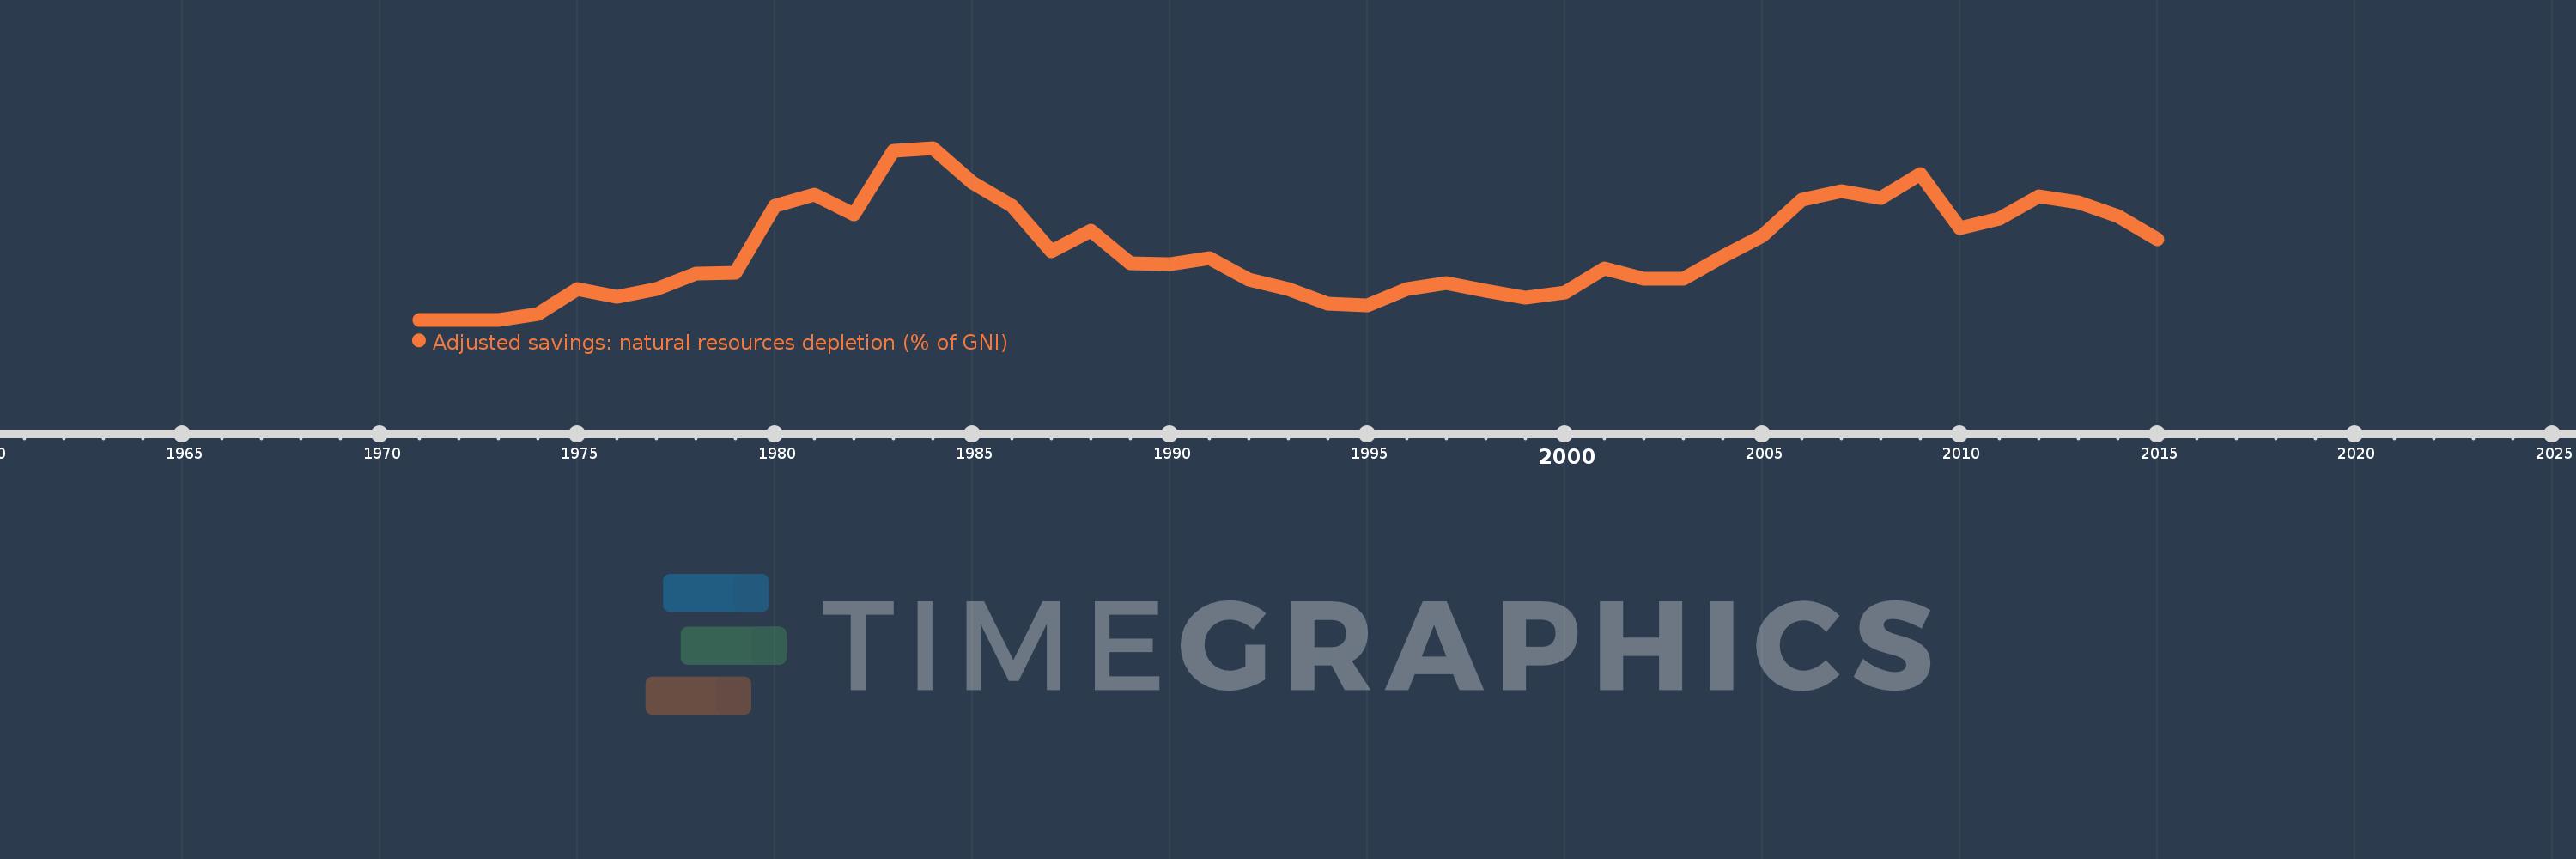
Adjusted savings: natural resources depletion (% of GNI)
2015,2014,2013,2012,2011,2010,2009,2008,2007,2006,2005,2004,2003,2002,2001,2000,1999,1998,1997,1996,1995,1994,1993,1992,1991,1990,1989,1988,1987,1986,1985,1984,1983,1982,1981,1980,1979,1978,1977,1976,1975,1974,1973,1972,1971
Estas estadísticas en otros países:
AfghanistanAlbaniaAlgeriaAngolaArab WorldArgentinaArmeniaAustraliaAustriaAzerbaijanBahamas, TheBahrainBangladeshBarbadosBelarusBelgiumBelizeBeninBhutanBoliviaBotswanaBrazilBrunei DarussalamBulgariaBurkina FasoBurundiCabo VerdeCambodiaCameroonCanadaCaribbean small statesCentral African RepublicCentral Europe and the BalticsChadChileChinaColombiaComorosCongo, Dem. Rep.Congo, Rep.Costa RicaCote d'IvoireCroatiaCubaCyprusCzech RepublicDenmarkDjiboutiDominicaDominican RepublicEarly-demographic dividendEast Asia & PacificEast Asia & Pacific (excluding high income)East Asia & Pacific (IDA & IBRD countries)EcuadorEgypt, Arab Rep.El SalvadorEquatorial GuineaEritreaEstoniaEthiopiaEuro areaEurope & Central AsiaEurope & Central Asia (excluding high income)Europe & Central Asia (IDA & IBRD countries)European UnionFijiFinlandFragile and conflict affected situationsFranceFrench PolynesiaGabonGambia, TheGeorgiaGermanyGhanaGreeceGuatemalaGuineaGuinea-BissauGuyanaHaitiHeavily indebted poor countries (HIPC)High incomeHondurasHong Kong SAR, ChinaHungaryIBRD onlyIcelandIDA & IBRD totalIDA blendIDA onlyIDA totalIndiaIndonesiaIran, Islamic Rep.IraqIrelandIsraelItalyJamaicaJapanJordanKazakhstanKenyaKiribatiKorea, Rep.KuwaitKyrgyz RepublicLao PDRLate-demographic dividendLatin America & Caribbean Latin America & Caribbean (excluding high income)Latin America & the Caribbean (IDA & IBRD countries)LatviaLeast developed countries: UN classificationLebanonLesothoLiberiaLibyaLithuaniaLow & middle incomeLow incomeLower middle incomeLuxembourgMacedonia, FYRMadagascarMalawiMalaysiaMaldivesMaliMauritaniaMauritiusMexicoMicronesia, Fed. Sts.Middle East & North AfricaMiddle East & North Africa (excluding high income)Middle East & North Africa (IDA & IBRD countries)Middle incomeMoldovaMongoliaMoroccoMozambiqueMyanmarNamibiaNepalNetherlandsNew CaledoniaNew ZealandNicaraguaNigerNigeriaNorth AmericaNorwayOECD membersOmanOther small statesPacific island small statesPakistanPanamaPapua New GuineaParaguayPeruPhilippinesPolandPortugalPost-demographic dividendPre-demographic dividendQatarRomaniaRussian FederationRwandaSamoaSao Tome and PrincipeSaudi ArabiaSenegalSeychellesSierra LeoneSingaporeSlovak RepublicSloveniaSmall statesSolomon IslandsSomaliaSouth AfricaSouth AsiaSouth Asia (IDA & IBRD)SpainSri LankaSt. LuciaSt. Vincent and the GrenadinesSub-Saharan Africa Sub-Saharan Africa (excluding high income)Sub-Saharan Africa (IDA & IBRD countries)SudanSurinameSwazilandSwedenSwitzerlandSyrian Arab RepublicTajikistanTanzaniaThailandTogoTongaTrinidad and TobagoTunisiaTurkeyTurkmenistanUgandaUkraineUnited Arab EmiratesUnited KingdomUnited StatesUpper middle incomeUruguayUzbekistanVanuatuVenezuela, RBVietnamWorldYemen, Rep.ZambiaZimbabwe línea de tiempo (timeline):
En esta escala de tiempo se presenta un gráfico de 1971 y 2015 de Mexico. Los datos de 1970 están ausentes. El número de observaciones reales por fecha: 45.
Fuente (nombre):
Indicadores del desarrollo mundial
Fuente (organización):
World Bank staff estimates based on sources and methods in World Bank's "The Changing Wealth of Nations: Measuring Sustainable Development in the New Millennium" (2011).
Categorías:
Economy & Growth, Energy & Mining
Se ha actualizado:
23 abr 2017 año
Los indicadores de los cambios de valor en los últimos años
Mínimo:
0.564
1 ene 1971 año
Máximo:
10.075
1 ene 1984 año
A la fecha de observación
Valor
Cambio absoluto
El cambio con respecto al valor anterior
1 ene 1971 año
0.564
+0.564
0.0%
1 ene 1972 año
0.572
+0.008
1.49%
1 ene 1973 año
0.573
+0.001
0.15%
1 ene 1974 año
0.874
+0.3
52.42%
1 ene 1975 año
2.259
+1.386
158.62%
1 ene 1976 año
1.857
-0.403
-17.82%
1 ene 1977 año
2.252
+0.396
21.32%
1 ene 1978 año
3.111
+0.859
38.12%
1 ene 1979 año
3.164
+0.053
1.72%
1 ene 1980 año
6.859
+3.694
116.74%
1 ene 1981 año
7.487
+0.628
9.16%
1 ene 1982 año
6.378
-1.108
-14.8%
1 ene 1983 año
9.931
+3.552
55.69%
1 ene 1984 año
10.075
+0.144
1.45%
1 ene 1985 año
8.157
-1.918
-19.04%
1 ene 1986 año
6.859
-1.298
-15.91%
1 ene 1987 año
4.373
-2.486
-36.24%
1 ene 1988 año
5.514
+1.141
26.09%
1 ene 1989 año
3.696
-1.818
-32.98%
1 ene 1990 año
3.654
-0.041
-1.11%
1 ene 1991 año
3.976
+0.322
8.81%
1 ene 1992 año
2.771
-1.205
-30.31%
1 ene 1993 año
2.283
-0.488
-17.6%
1 ene 1994 año
1.461
-0.823
-36.02%
1 ene 1995 año
1.341
-0.12
-8.22%
1 ene 1996 año
2.256
+0.916
68.28%
1 ene 1997 año
2.586
+0.33
14.61%
1 ene 1998 año
2.187
-0.399
-15.43%
1 ene 1999 año
1.801
-0.386
-17.66%
1 ene 2000 año
2.059
+0.258
14.35%
1 ene 2001 año
3.393
+1.333
64.76%
1 ene 2002 año
2.829
-0.564
-16.62%
1 ene 2003 año
2.848
+0.019
0.66%
1 ene 2004 año
4.07
+1.223
42.95%
1 ene 2005 año
5.188
+1.117
27.45%
1 ene 2006 año
7.192
+2.004
38.63%
1 ene 2007 año
7.667
+0.475
6.61%
1 ene 2008 año
7.304
-0.363
-4.74%
1 ene 2009 año
8.612
+1.308
17.91%
1 ene 2010 año
5.623
-2.989
-34.71%
1 ene 2011 año
6.173
+0.55
9.78%
1 ene 2012 año
7.396
+1.223
19.82%
1 ene 2013 año
7.071
-0.326
-4.4%
1 ene 2014 año
6.31
-0.761
-10.76%
1 ene 2015 año
4.997
-1.313
-20.81%
Ranking de los países por los datos estadísticos actuales


Comentarios: