29
/es/
es
AIzaSyAYiBZKx7MnpbEhh9jyipgxe19OcubqV5w
April 1, 2024
36334
IBRD only
IBD
false
2
1
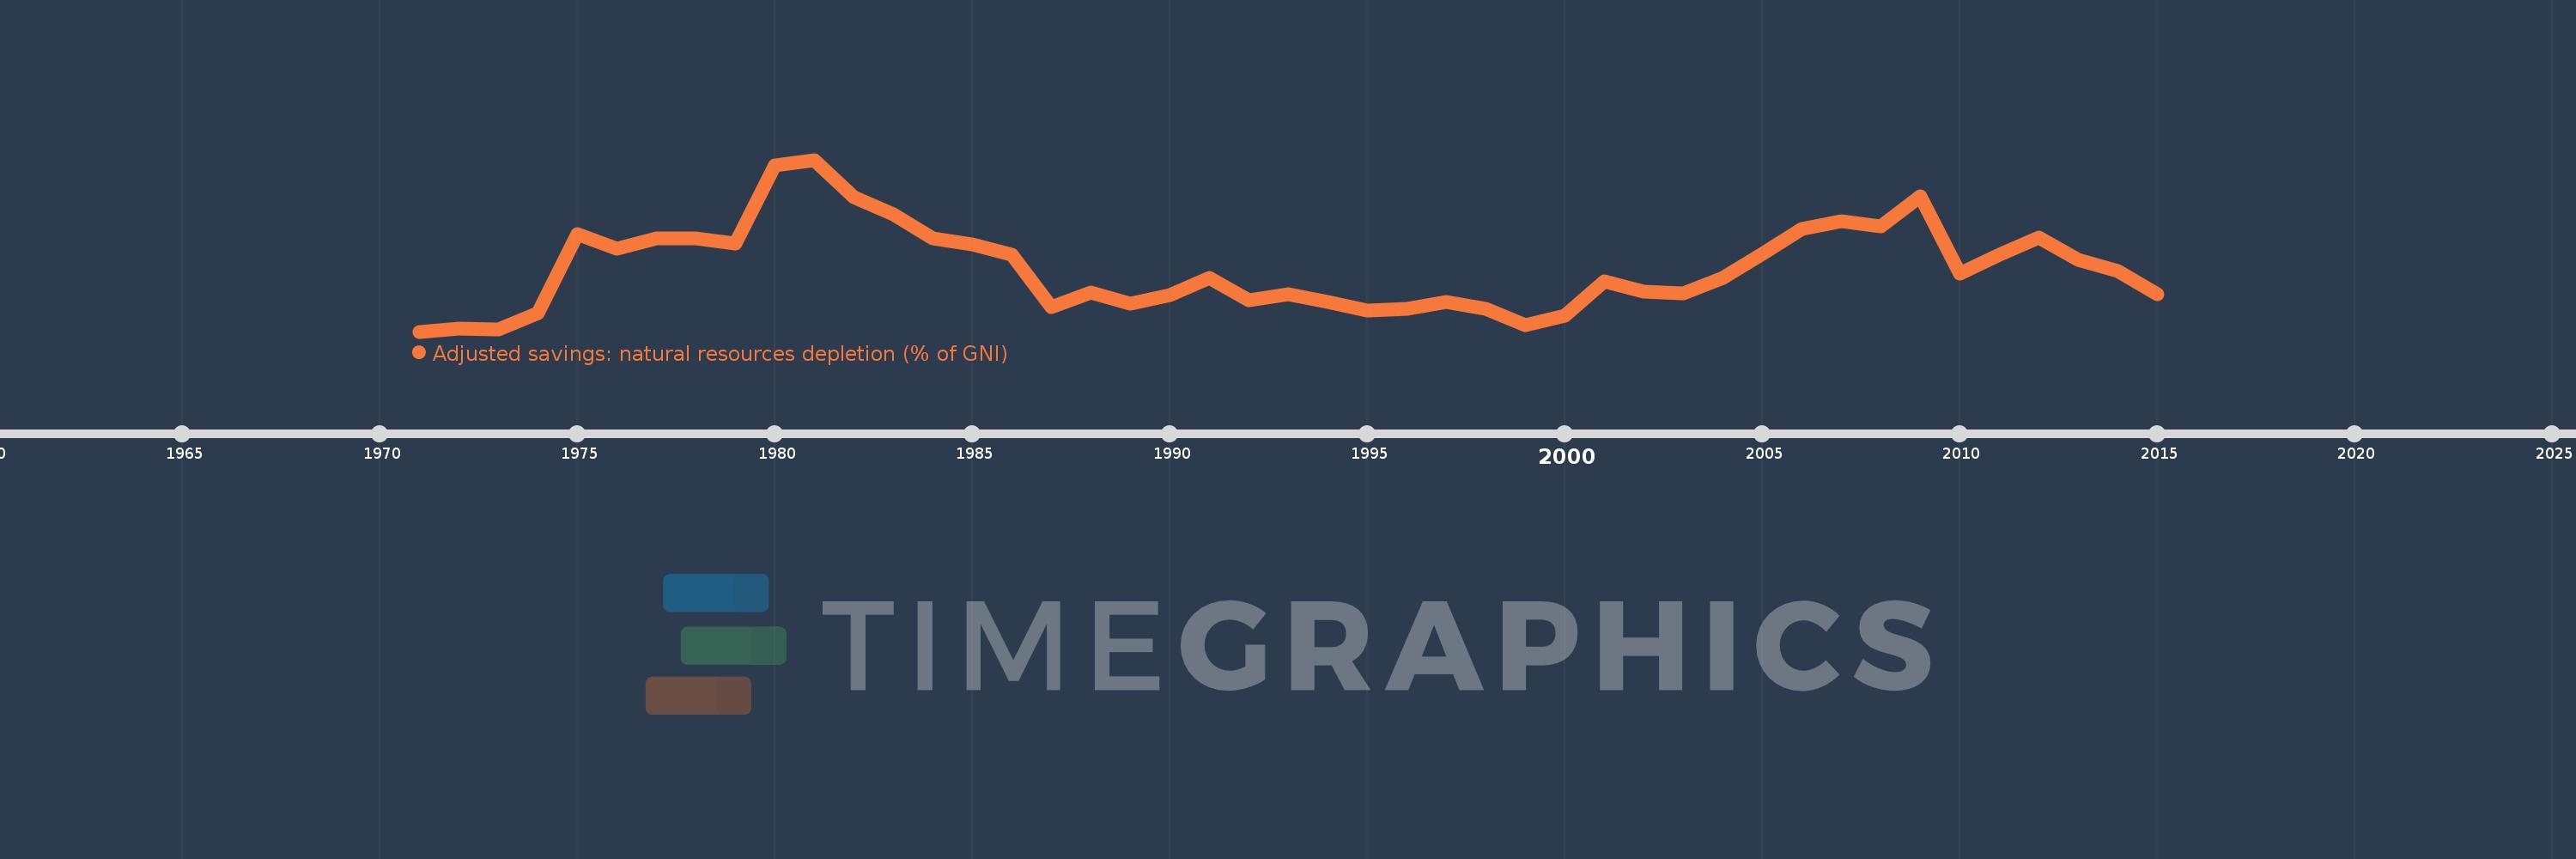
Adjusted savings: natural resources depletion (% of GNI)
2015,2014,2013,2012,2011,2010,2009,2008,2007,2006,2005,2004,2003,2002,2001,2000,1999,1998,1997,1996,1995,1994,1993,1992,1991,1990,1989,1988,1987,1986,1985,1984,1983,1982,1981,1980,1979,1978,1977,1976,1975,1974,1973,1972,1971
Estas estadísticas en otros países:
AfghanistanAlbaniaAlgeriaAngolaArab WorldArgentinaArmeniaAustraliaAustriaAzerbaijanBahamas, TheBahrainBangladeshBarbadosBelarusBelgiumBelizeBeninBhutanBoliviaBotswanaBrazilBrunei DarussalamBulgariaBurkina FasoBurundiCabo VerdeCambodiaCameroonCanadaCaribbean small statesCentral African RepublicCentral Europe and the BalticsChadChileChinaColombiaComorosCongo, Dem. Rep.Congo, Rep.Costa RicaCote d'IvoireCroatiaCubaCyprusCzech RepublicDenmarkDjiboutiDominicaDominican RepublicEarly-demographic dividendEast Asia & PacificEast Asia & Pacific (excluding high income)East Asia & Pacific (IDA & IBRD countries)EcuadorEgypt, Arab Rep.El SalvadorEquatorial GuineaEritreaEstoniaEthiopiaEuro areaEurope & Central AsiaEurope & Central Asia (excluding high income)Europe & Central Asia (IDA & IBRD countries)European UnionFijiFinlandFragile and conflict affected situationsFranceFrench PolynesiaGabonGambia, TheGeorgiaGermanyGhanaGreeceGuatemalaGuineaGuinea-BissauGuyanaHaitiHeavily indebted poor countries (HIPC)High incomeHondurasHong Kong SAR, ChinaHungaryIBRD onlyIcelandIDA & IBRD totalIDA blendIDA onlyIDA totalIndiaIndonesiaIran, Islamic Rep.IraqIrelandIsraelItalyJamaicaJapanJordanKazakhstanKenyaKiribatiKorea, Rep.KuwaitKyrgyz RepublicLao PDRLate-demographic dividendLatin America & Caribbean Latin America & Caribbean (excluding high income)Latin America & the Caribbean (IDA & IBRD countries)LatviaLeast developed countries: UN classificationLebanonLesothoLiberiaLibyaLithuaniaLow & middle incomeLow incomeLower middle incomeLuxembourgMacedonia, FYRMadagascarMalawiMalaysiaMaldivesMaliMauritaniaMauritiusMexicoMicronesia, Fed. Sts.Middle East & North AfricaMiddle East & North Africa (excluding high income)Middle East & North Africa (IDA & IBRD countries)Middle incomeMoldovaMongoliaMoroccoMozambiqueMyanmarNamibiaNepalNetherlandsNew CaledoniaNew ZealandNicaraguaNigerNigeriaNorth AmericaNorwayOECD membersOmanOther small statesPacific island small statesPakistanPanamaPapua New GuineaParaguayPeruPhilippinesPolandPortugalPost-demographic dividendPre-demographic dividendQatarRomaniaRussian FederationRwandaSamoaSao Tome and PrincipeSaudi ArabiaSenegalSeychellesSierra LeoneSingaporeSlovak RepublicSloveniaSmall statesSolomon IslandsSomaliaSouth AfricaSouth AsiaSouth Asia (IDA & IBRD)SpainSri LankaSt. LuciaSt. Vincent and the GrenadinesSub-Saharan Africa Sub-Saharan Africa (excluding high income)Sub-Saharan Africa (IDA & IBRD countries)SudanSurinameSwazilandSwedenSwitzerlandSyrian Arab RepublicTajikistanTanzaniaThailandTogoTongaTrinidad and TobagoTunisiaTurkeyTurkmenistanUgandaUkraineUnited Arab EmiratesUnited KingdomUnited StatesUpper middle incomeUruguayUzbekistanVanuatuVenezuela, RBVietnamWorldYemen, Rep.ZambiaZimbabwe línea de tiempo (timeline):
En esta escala de tiempo se presenta un gráfico de 1971 y 2015 de IBRD only. Los datos de 1970 están ausentes. El número de observaciones reales por fecha: 45.
Fuente (nombre):
Indicadores del desarrollo mundial
Fuente (organización):
World Bank staff estimates based on sources and methods in World Bank's "The Changing Wealth of Nations: Measuring Sustainable Development in the New Millennium" (2011).
Categorías:
Economy & Growth, Energy & Mining
Se ha actualizado:
23 abr 2017 año
Los indicadores de los cambios de valor en los últimos años
Mínimo:
1.713
1 ene 1971 año
Máximo:
10.841
1 ene 1981 año
A la fecha de observación
Valor
Cambio absoluto
El cambio con respecto al valor anterior
1 ene 1971 año
1.713
+1.713
0.0%
1 ene 1972 año
1.858
+0.145
8.46%
1 ene 1973 año
1.839
-0.018
-0.98%
1 ene 1974 año
2.679
+0.839
45.62%
1 ene 1975 año
6.908
+4.229
157.89%
1 ene 1976 año
6.116
-0.792
-11.46%
1 ene 1977 año
6.674
+0.558
9.13%
1 ene 1978 año
6.661
-0.013
-0.2%
1 ene 1979 año
6.391
-0.27
-4.06%
1 ene 1980 año
10.525
+4.134
64.69%
1 ene 1981 año
10.841
+0.316
3.0%
1 ene 1982 año
8.837
-2.004
-18.49%
1 ene 1983 año
7.922
-0.915
-10.36%
1 ene 1984 año
6.658
-1.263
-15.95%
1 ene 1985 año
6.353
-0.305
-4.58%
1 ene 1986 año
5.8
-0.553
-8.7%
1 ene 1987 año
3.007
-2.793
-48.15%
1 ene 1988 año
3.808
+0.8
26.61%
1 ene 1989 año
3.211
-0.597
-15.67%
1 ene 1990 año
3.655
+0.444
13.83%
1 ene 1991 año
4.588
+0.933
25.52%
1 ene 1992 año
3.362
-1.226
-26.72%
1 ene 1993 año
3.695
+0.332
9.89%
1 ene 1994 año
3.286
-0.408
-11.05%
1 ene 1995 año
2.813
-0.473
-14.4%
1 ene 1996 año
2.934
+0.122
4.32%
1 ene 1997 año
3.276
+0.341
11.64%
1 ene 1998 año
2.924
-0.352
-10.75%
1 ene 1999 año
2.062
-0.862
-29.49%
1 ene 2000 año
2.578
+0.517
25.06%
1 ene 2001 año
4.387
+1.809
70.16%
1 ene 2002 año
3.831
-0.557
-12.69%
1 ene 2003 año
3.734
-0.096
-2.52%
1 ene 2004 año
4.562
+0.827
22.16%
1 ene 2005 año
5.828
+1.266
27.76%
1 ene 2006 año
7.186
+1.358
23.3%
1 ene 2007 año
7.585
+0.399
5.55%
1 ene 2008 año
7.29
-0.295
-3.88%
1 ene 2009 año
8.886
+1.596
21.89%
1 ene 2010 año
4.805
-4.081
-45.93%
1 ene 2011 año
5.818
+1.013
21.08%
1 ene 2012 año
6.711
+0.893
15.36%
1 ene 2013 año
5.524
-1.187
-17.69%
1 ene 2014 año
4.918
-0.606
-10.98%
1 ene 2015 año
3.687
-1.231
-25.02%
Ranking de los países por los datos estadísticos actuales


Comentarios: