29
/es/
es
AIzaSyAYiBZKx7MnpbEhh9jyipgxe19OcubqV5w
April 1, 2024
39229
IDA only
IDX
false
2
1
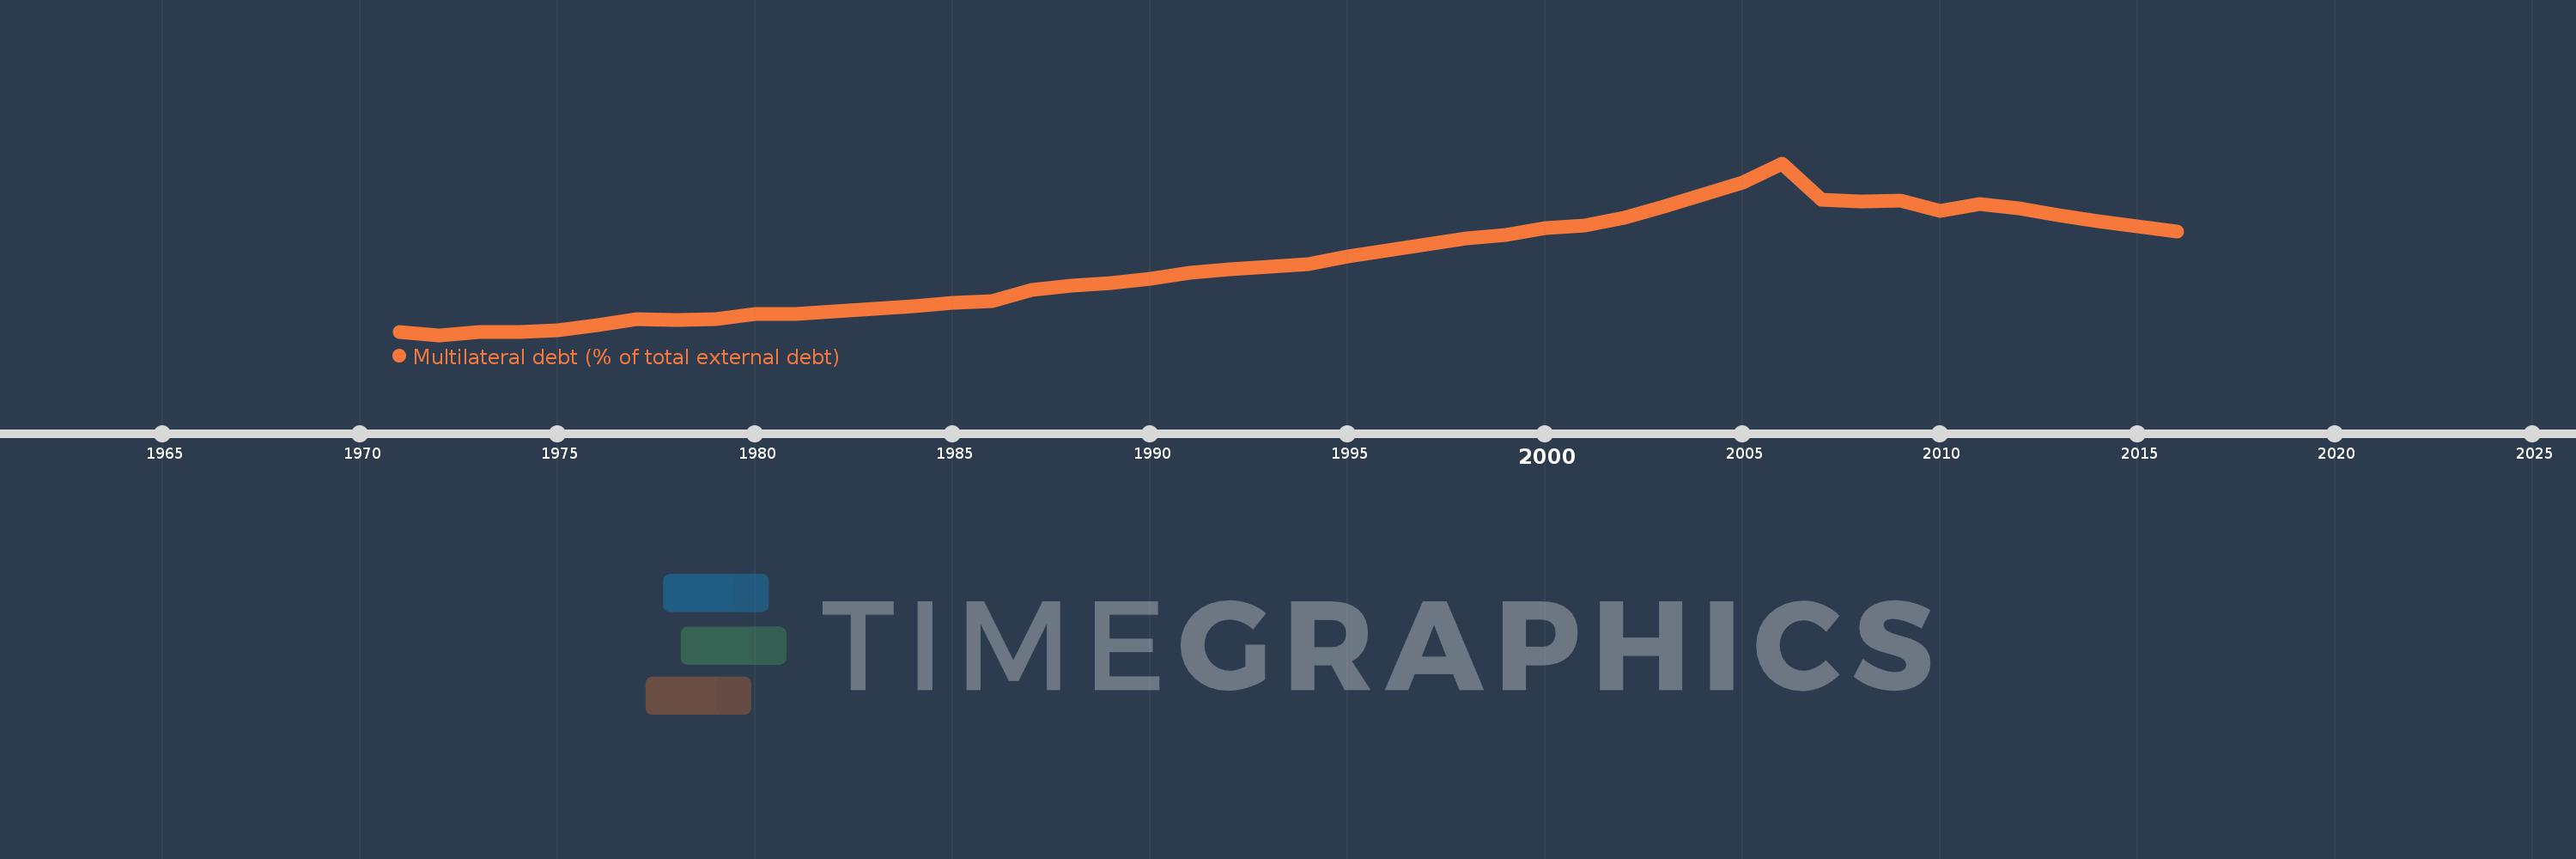
Multilateral debt (% of total external debt)
2016,2015,2014,2013,2012,2011,2010,2009,2008,2007,2006,2005,2004,2003,2002,2001,2000,1999,1998,1997,1996,1995,1994,1993,1992,1991,1990,1989,1988,1987,1986,1985,1984,1983,1982,1981,1980,1979,1978,1977,1976,1975,1974,1973,1972,1971
Estas estadísticas en otros países:
línea de tiempo (timeline):
En esta escala de tiempo se presenta un gráfico de 1971 y 2016 de IDA only. Los datos de 1970 están ausentes. El número de observaciones reales por fecha: 46.
Fuente (nombre):
Indicadores del desarrollo mundial
Fuente (organización):
World Bank, International Debt Statistics.
Categorías:
External Debt
Se ha actualizado:
23 abr 2017 año
Los indicadores de los cambios de valor en los últimos años
Mínimo:
11.228
1 ene 1972 año
Máximo:
51.635
1 ene 2006 año
A la fecha de observación
Valor
Cambio absoluto
El cambio con respecto al valor anterior
1 ene 1971 año
11.87
+11.87
0.0%
1 ene 1972 año
11.228
-0.643
-5.42%
1 ene 1973 año
11.973
+0.745
6.64%
1 ene 1974 año
12.024
+0.051
0.43%
1 ene 1975 año
12.302
+0.278
2.31%
1 ene 1976 año
13.476
+1.173
9.54%
1 ene 1977 año
15.038
+1.562
11.59%
1 ene 1978 año
14.704
-0.334
-2.22%
1 ene 1979 año
15.048
+0.345
2.34%
1 ene 1980 año
16.155
+1.106
7.35%
1 ene 1981 año
16.119
-0.035
-0.22%
1 ene 1982 año
16.739
+0.62
3.85%
1 ene 1983 año
17.452
+0.713
4.26%
1 ene 1984 año
17.958
+0.506
2.9%
1 ene 1985 año
18.852
+0.894
4.98%
1 ene 1986 año
19.222
+0.37
1.96%
1 ene 1987 año
21.85
+2.628
13.67%
1 ene 1988 año
22.855
+1.005
4.6%
1 ene 1989 año
23.451
+0.596
2.61%
1 ene 1990 año
24.418
+0.967
4.12%
1 ene 1991 año
25.951
+1.533
6.28%
1 ene 1992 año
26.659
+0.708
2.73%
1 ene 1993 año
27.229
+0.571
2.14%
1 ene 1994 año
27.901
+0.672
2.47%
1 ene 1995 año
29.757
+1.855
6.65%
1 ene 1996 año
31.038
+1.281
4.31%
1 ene 1997 año
32.533
+1.495
4.82%
1 ene 1998 año
33.927
+1.394
4.29%
1 ene 1999 año
34.752
+0.825
2.43%
1 ene 2000 año
36.344
+1.592
4.58%
1 ene 2001 año
37.061
+0.717
1.97%
1 ene 2002 año
38.793
+1.732
4.67%
1 ene 2003 año
41.428
+2.635
6.79%
1 ene 2004 año
44.35
+2.923
7.05%
1 ene 2005 año
47.05
+2.699
6.09%
1 ene 2006 año
51.635
+4.585
9.75%
1 ene 2007 año
43.058
-8.577
-16.61%
1 ene 2008 año
42.702
-0.357
-0.83%
1 ene 2009 año
42.836
+0.135
0.32%
1 ene 2010 año
40.451
-2.385
-5.57%
1 ene 2011 año
42.036
+1.584
3.92%
1 ene 2012 año
40.97
-1.066
-2.54%
1 ene 2013 año
39.497
-1.473
-3.6%
1 ene 2014 año
38.071
-1.426
-3.61%
1 ene 2015 año
36.719
-1.351
-3.55%
1 ene 2016 año
35.513
-1.206
-3.29%
Ranking de los países por los datos estadísticos actuales


Comentarios: