29
/es/
es
AIzaSyAYiBZKx7MnpbEhh9jyipgxe19OcubqV5w
April 1, 2024
111251
Congo, Rep.
COG
true
2
1
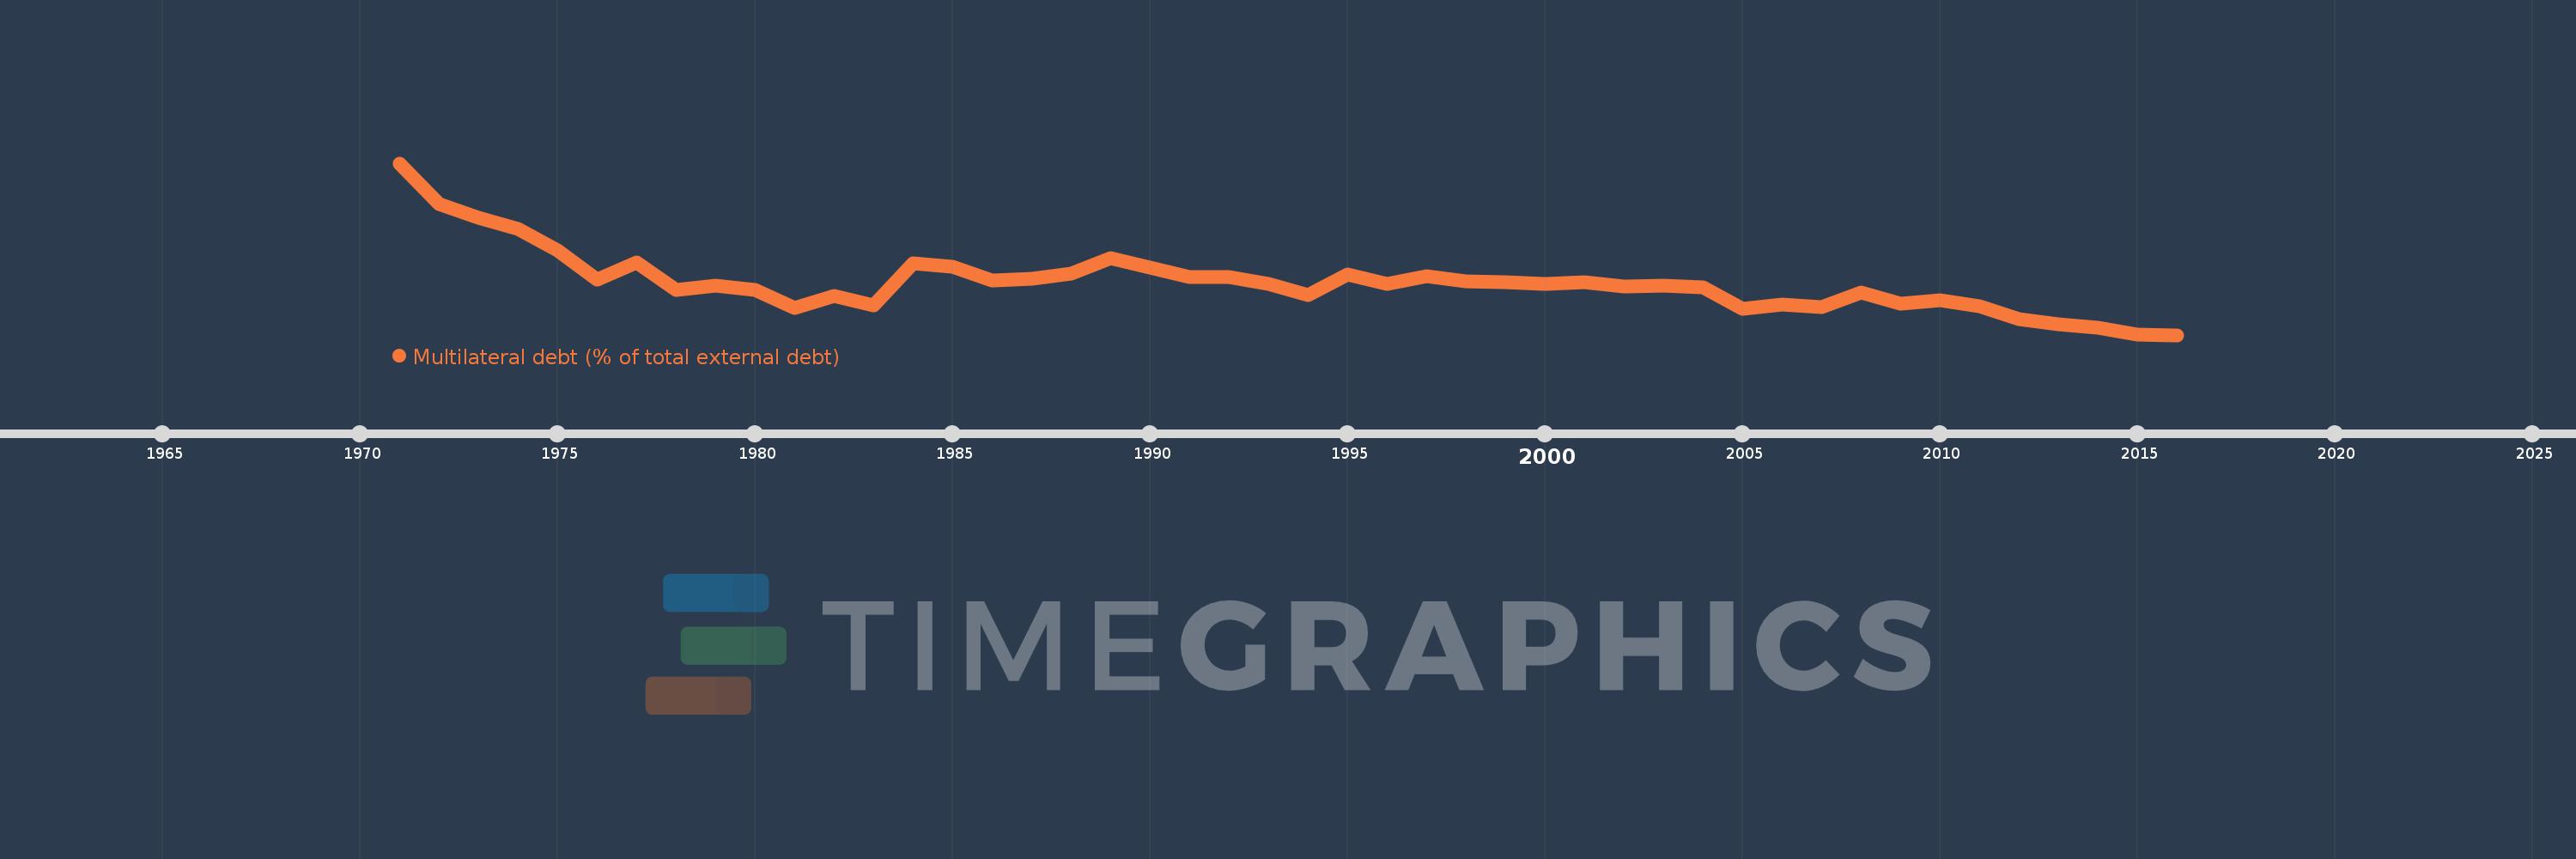
Multilateral debt (% of total external debt)
2016,2015,2014,2013,2012,2011,2010,2009,2008,2007,2006,2005,2004,2003,2002,2001,2000,1999,1998,1997,1996,1995,1994,1993,1992,1991,1990,1989,1988,1987,1986,1985,1984,1983,1982,1981,1980,1979,1978,1977,1976,1975,1974,1973,1972,1971
Estas estadísticas en otros países:
línea de tiempo (timeline):
En esta escala de tiempo se presenta un gráfico de 1971 y 2016 de Congo, Rep.. Los datos de 1970 están ausentes. El número de observaciones reales por fecha: 46.
Fuente (nombre):
Indicadores del desarrollo mundial
Fuente (organización):
World Bank, International Debt Statistics.
Categorías:
External Debt
Se ha actualizado:
23 abr 2017 año
Los indicadores de los cambios de valor en los últimos años
Mínimo:
4.493
1 ene 2016 año
Máximo:
24.659
1 ene 1971 año
A la fecha de observación
Valor
Cambio absoluto
El cambio con respecto al valor anterior
1 ene 1971 año
24.659
+24.659
0.0%
1 ene 1972 año
19.889
-4.77
-19.34%
1 ene 1973 año
18.268
-1.621
-8.15%
1 ene 1974 año
16.986
-1.282
-7.02%
1 ene 1975 año
14.382
-2.604
-15.33%
1 ene 1976 año
11.011
-3.371
-23.44%
1 ene 1977 año
12.995
+1.984
18.02%
1 ene 1978 año
9.806
-3.189
-24.54%
1 ene 1979 año
10.329
+0.523
5.33%
1 ene 1980 año
9.737
-0.592
-5.73%
1 ene 1981 año
7.712
-2.025
-20.8%
1 ene 1982 año
9.091
+1.379
17.88%
1 ene 1983 año
7.995
-1.096
-12.06%
1 ene 1984 año
12.955
+4.961
62.05%
1 ene 1985 año
12.491
-0.464
-3.59%
1 ene 1986 año
10.939
-1.552
-12.42%
1 ene 1987 año
11.082
+0.143
1.31%
1 ene 1988 año
11.683
+0.601
5.42%
1 ene 1989 año
13.502
+1.819
15.57%
1 ene 1990 año
12.388
-1.114
-8.25%
1 ene 1991 año
11.295
-1.093
-8.82%
1 ene 1992 año
11.287
-0.008
-0.07%
1 ene 1993 año
10.501
-0.786
-6.97%
1 ene 1994 año
9.157
-1.343
-12.79%
1 ene 1995 año
11.639
+2.482
27.11%
1 ene 1996 año
10.502
-1.138
-9.78%
1 ene 1997 año
11.423
+0.921
8.77%
1 ene 1998 año
10.774
-0.649
-5.68%
1 ene 1999 año
10.736
-0.037
-0.34%
1 ene 2000 año
10.457
-0.279
-2.6%
1 ene 2001 año
10.673
+0.216
2.07%
1 ene 2002 año
10.18
-0.494
-4.63%
1 ene 2003 año
10.277
+0.097
0.95%
1 ene 2004 año
10.132
-0.145
-1.41%
1 ene 2005 año
7.534
-2.598
-25.64%
1 ene 2006 año
8.045
+0.511
6.78%
1 ene 2007 año
7.739
-0.306
-3.8%
1 ene 2008 año
9.482
+1.743
22.52%
1 ene 2009 año
8.21
-1.272
-13.41%
1 ene 2010 año
8.6
+0.39
4.75%
1 ene 2011 año
7.874
-0.726
-8.44%
1 ene 2012 año
6.353
-1.521
-19.31%
1 ene 2013 año
5.765
-0.588
-9.26%
1 ene 2014 año
5.389
-0.376
-6.52%
1 ene 2015 año
4.583
-0.806
-14.96%
1 ene 2016 año
4.493
-0.09
-1.96%
Ranking de los países por los datos estadísticos actuales


Comentarios: