29
/es/
es
AIzaSyAYiBZKx7MnpbEhh9jyipgxe19OcubqV5w
April 1, 2024
268317
Tunisia
TUN
true
2
1
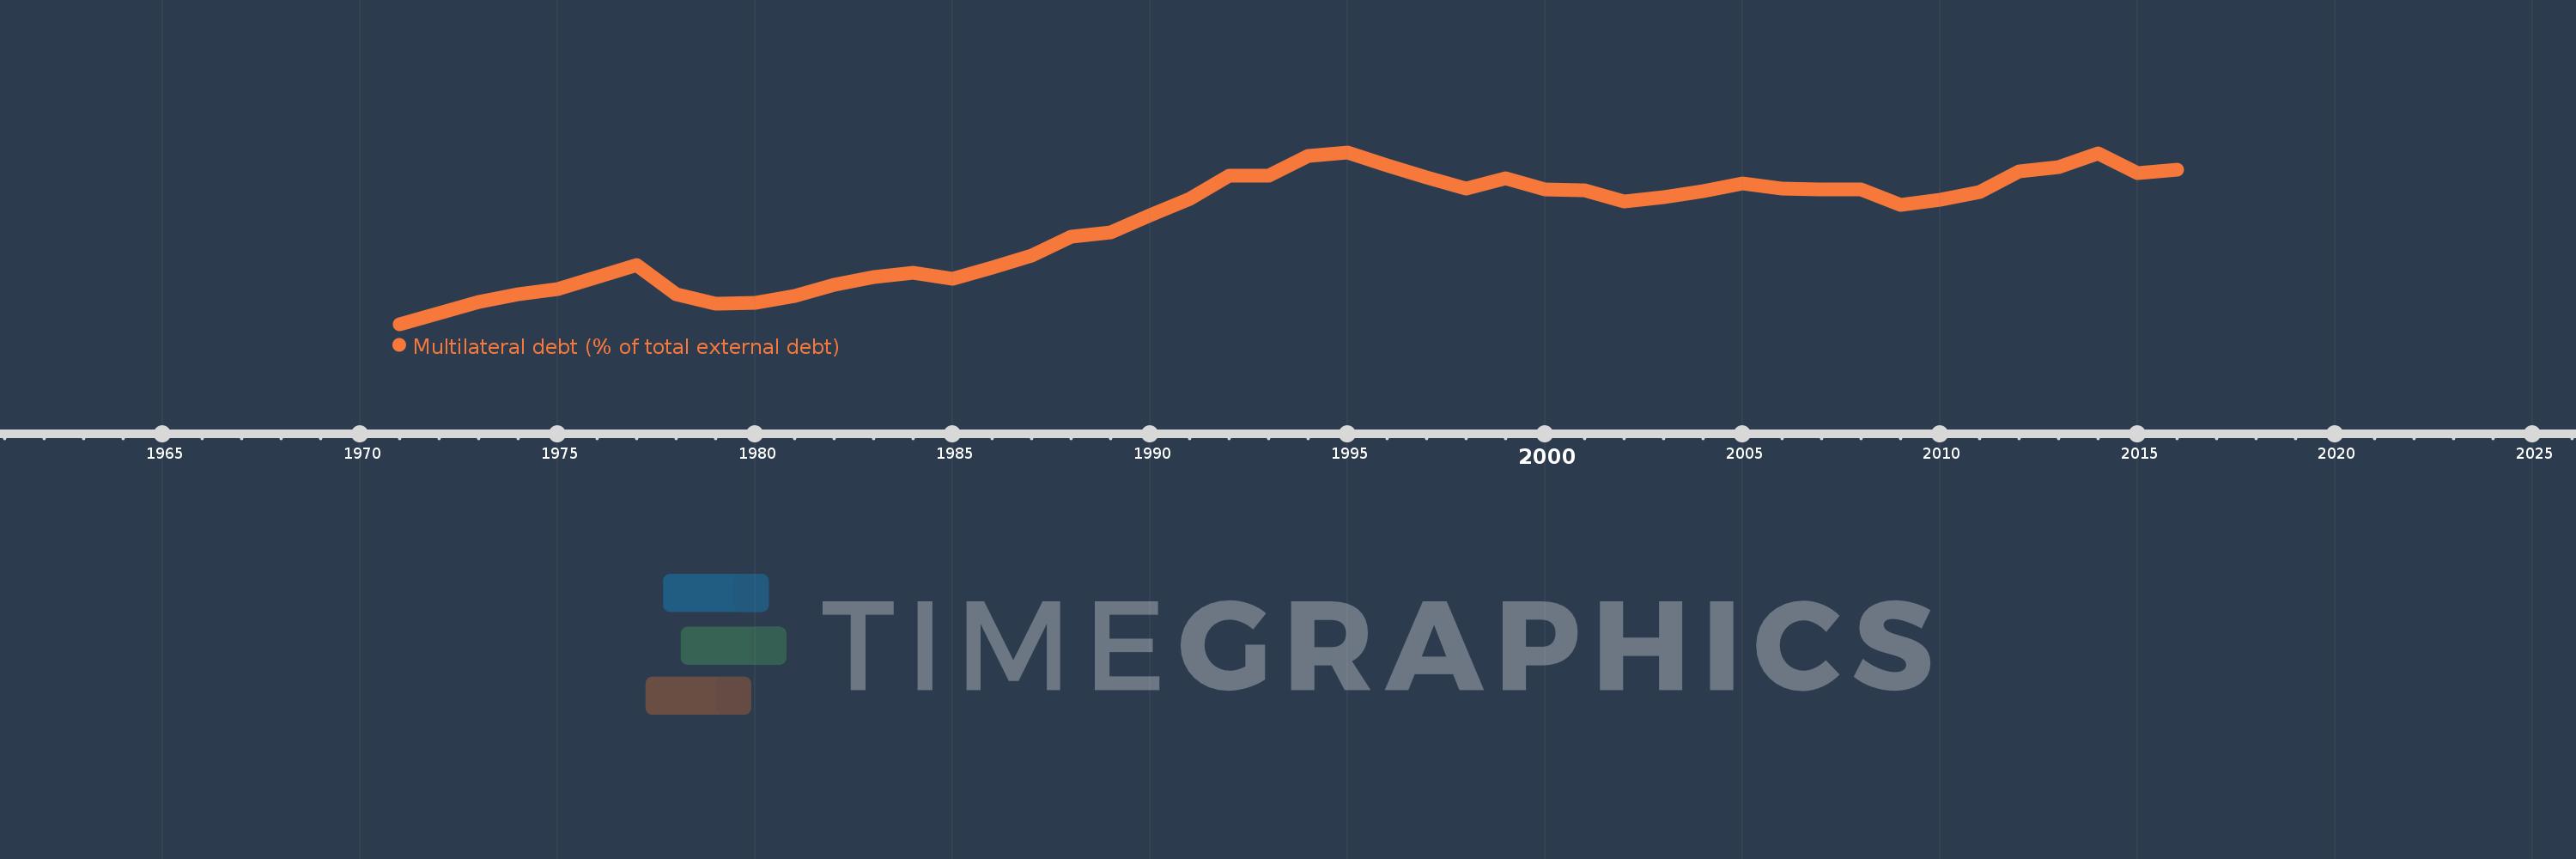
Multilateral debt (% of total external debt)
2016,2015,2014,2013,2012,2011,2010,2009,2008,2007,2006,2005,2004,2003,2002,2001,2000,1999,1998,1997,1996,1995,1994,1993,1992,1991,1990,1989,1988,1987,1986,1985,1984,1983,1982,1981,1980,1979,1978,1977,1976,1975,1974,1973,1972,1971
Estas estadísticas en otros países:
línea de tiempo (timeline):
En esta escala de tiempo se presenta un gráfico de 1971 y 2016 de Tunisia. Los datos de 1970 están ausentes. El número de observaciones reales por fecha: 46.
Fuente (nombre):
Indicadores del desarrollo mundial
Fuente (organización):
World Bank, International Debt Statistics.
Categorías:
External Debt
Se ha actualizado:
23 abr 2017 año
Los indicadores de los cambios de valor en los últimos años
Mínimo:
7.259
1 ene 1971 año
Máximo:
37.147
1 ene 1995 año
A la fecha de observación
Valor
Cambio absoluto
El cambio con respecto al valor anterior
1 ene 1971 año
7.259
+7.259
0.0%
1 ene 1972 año
9.223
+1.964
27.05%
1 ene 1973 año
11.078
+1.855
20.11%
1 ene 1974 año
12.431
+1.353
12.22%
1 ene 1975 año
13.317
+0.886
7.13%
1 ene 1976 año
15.524
+2.207
16.57%
1 ene 1977 año
17.581
+2.057
13.25%
1 ene 1978 año
12.539
-5.041
-28.68%
1 ene 1979 año
10.769
-1.771
-14.12%
1 ene 1980 año
10.913
+0.144
1.34%
1 ene 1981 año
12.246
+1.334
12.22%
1 ene 1982 año
14.047
+1.801
14.7%
1 ene 1983 año
15.409
+1.362
9.7%
1 ene 1984 año
16.258
+0.848
5.51%
1 ene 1985 año
15.097
-1.16
-7.14%
1 ene 1986 año
17.116
+2.019
13.37%
1 ene 1987 año
19.161
+2.045
11.95%
1 ene 1988 año
22.5
+3.338
17.42%
1 ene 1989 año
23.241
+0.741
3.29%
1 ene 1990 año
26.15
+2.909
12.52%
1 ene 1991 año
29.033
+2.883
11.02%
1 ene 1992 año
33.139
+4.106
14.14%
1 ene 1993 año
33.1
-0.038
-0.12%
1 ene 1994 año
36.594
+3.493
10.55%
1 ene 1995 año
37.147
+0.553
1.51%
1 ene 1996 año
34.96
-2.187
-5.89%
1 ene 1997 año
32.73
-2.231
-6.38%
1 ene 1998 año
30.928
-1.801
-5.5%
1 ene 1999 año
32.695
+1.767
5.71%
1 ene 2000 año
30.727
-1.968
-6.02%
1 ene 2001 año
30.616
-0.111
-0.36%
1 ene 2002 año
28.562
-2.054
-6.71%
1 ene 2003 año
29.287
+0.724
2.54%
1 ene 2004 año
30.371
+1.084
3.7%
1 ene 2005 año
31.68
+1.309
4.31%
1 ene 2006 año
30.87
-0.81
-2.56%
1 ene 2007 año
30.645
-0.225
-0.73%
1 ene 2008 año
30.713
+0.068
0.22%
1 ene 2009 año
27.981
-2.732
-8.9%
1 ene 2010 año
28.944
+0.963
3.44%
1 ene 2011 año
30.226
+1.282
4.43%
1 ene 2012 año
33.839
+3.613
11.95%
1 ene 2013 año
34.646
+0.807
2.38%
1 ene 2014 año
36.928
+2.283
6.59%
1 ene 2015 año
33.486
-3.443
-9.32%
1 ene 2016 año
34.191
+0.706
2.11%
Ranking de los países por los datos estadísticos actuales


Comentarios: