29
/es/
es
AIzaSyAYiBZKx7MnpbEhh9jyipgxe19OcubqV5w
April 1, 2024
194559
Mauritius
MUS
true
2
1
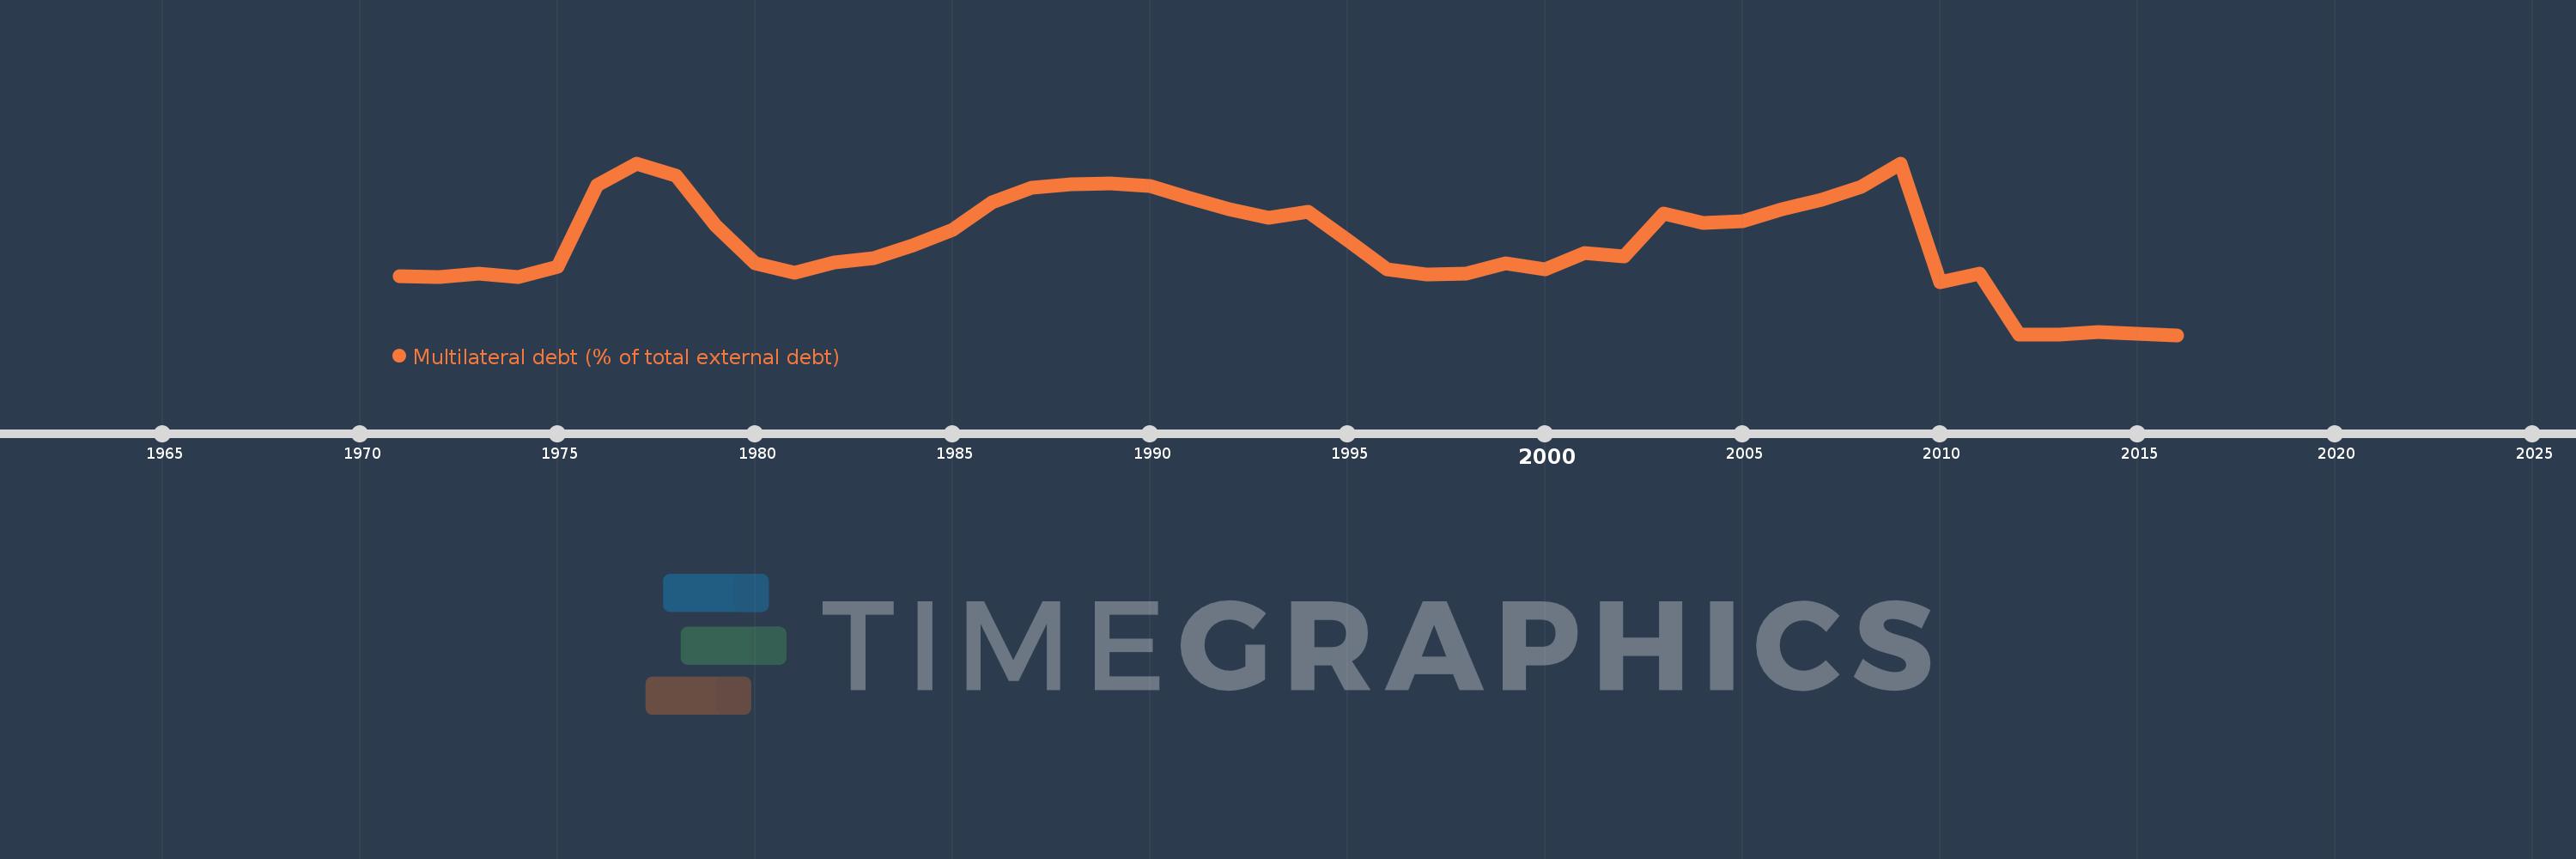
Multilateral debt (% of total external debt)
2016,2015,2014,2013,2012,2011,2010,2009,2008,2007,2006,2005,2004,2003,2002,2001,2000,1999,1998,1997,1996,1995,1994,1993,1992,1991,1990,1989,1988,1987,1986,1985,1984,1983,1982,1981,1980,1979,1978,1977,1976,1975,1974,1973,1972,1971
Estas estadísticas en otros países:
línea de tiempo (timeline):
En esta escala de tiempo se presenta un gráfico de 1971 y 2016 de Mauritius. Los datos de 1970 están ausentes. El número de observaciones reales por fecha: 46.
Fuente (nombre):
Indicadores del desarrollo mundial
Fuente (organización):
World Bank, International Debt Statistics.
Categorías:
External Debt
Se ha actualizado:
23 abr 2017 año
Los indicadores de los cambios de valor en los últimos años
Mínimo:
6.077
1 ene 2016 año
Máximo:
40.251
1 ene 1977 año
A la fecha de observación
Valor
Cambio absoluto
El cambio con respecto al valor anterior
1 ene 1971 año
17.796
+17.796
0.0%
1 ene 1972 año
17.566
-0.23
-1.29%
1 ene 1973 año
18.305
+0.739
4.2%
1 ene 1974 año
17.58
-0.725
-3.96%
1 ene 1975 año
19.588
+2.009
11.43%
1 ene 1976 año
35.93
+16.342
83.43%
1 ene 1977 año
40.251
+4.321
12.03%
1 ene 1978 año
37.824
-2.428
-6.03%
1 ene 1979 año
27.816
-10.007
-26.46%
1 ene 1980 año
20.374
-7.443
-26.76%
1 ene 1981 año
18.469
-1.905
-9.35%
1 ene 1982 año
20.438
+1.97
10.66%
1 ene 1983 año
21.421
+0.983
4.81%
1 ene 1984 año
23.912
+2.491
11.63%
1 ene 1985 año
27.081
+3.169
13.25%
1 ene 1986 año
32.448
+5.367
19.82%
1 ene 1987 año
35.414
+2.966
9.14%
1 ene 1988 año
36.045
+0.63
1.78%
1 ene 1989 año
36.274
+0.229
0.64%
1 ene 1990 año
35.663
-0.611
-1.69%
1 ene 1991 año
33.337
-2.326
-6.52%
1 ene 1992 año
31.101
-2.236
-6.71%
1 ene 1993 año
29.431
-1.669
-5.37%
1 ene 1994 año
30.64
+1.208
4.11%
1 ene 1995 año
25.023
-5.616
-18.33%
1 ene 1996 año
19.064
-5.959
-23.81%
1 ene 1997 año
18.075
-0.99
-5.19%
1 ene 1998 año
18.273
+0.198
1.1%
1 ene 1999 año
20.333
+2.061
11.28%
1 ene 2000 año
19.115
-1.218
-5.99%
1 ene 2001 año
22.312
+3.196
16.72%
1 ene 2002 año
21.707
-0.604
-2.71%
1 ene 2003 año
30.253
+8.546
39.37%
1 ene 2004 año
28.343
-1.91
-6.31%
1 ene 2005 año
28.714
+0.371
1.31%
1 ene 2006 año
31.108
+2.394
8.34%
1 ene 2007 año
33.023
+1.914
6.15%
1 ene 2008 año
35.485
+2.462
7.46%
1 ene 2009 año
40.229
+4.744
13.37%
1 ene 2010 año
16.632
-23.597
-58.66%
1 ene 2011 año
18.315
+1.683
10.12%
1 ene 2012 año
6.078
-12.237
-66.81%
1 ene 2013 año
6.242
+0.164
2.7%
1 ene 2014 año
6.609
+0.367
5.88%
1 ene 2015 año
6.306
-0.303
-4.58%
1 ene 2016 año
6.077
-0.23
-3.64%
Ranking de los países por los datos estadísticos actuales


Comentarios: