29
/es/
es
AIzaSyAYiBZKx7MnpbEhh9jyipgxe19OcubqV5w
April 1, 2024
39196
IDA only
IDX
false
2
1
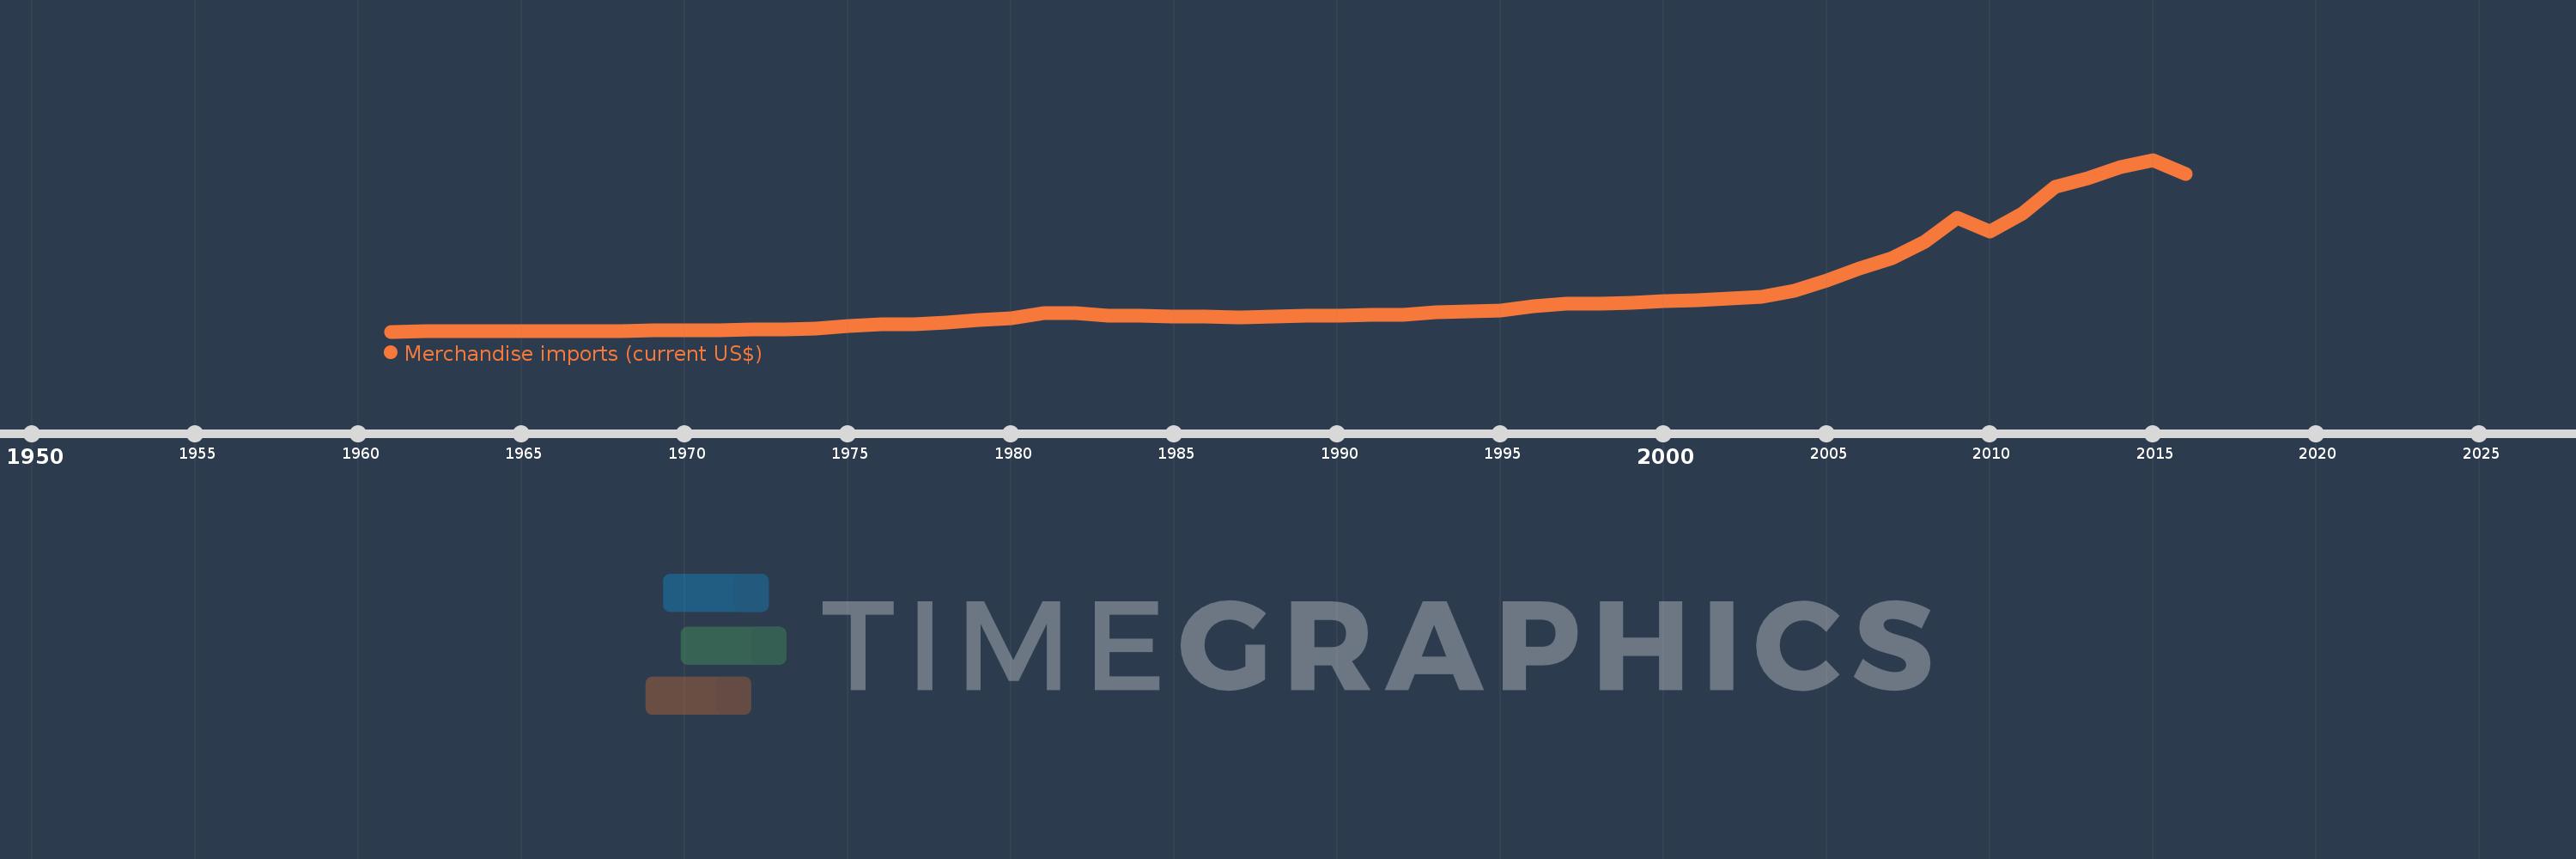
Merchandise imports (current US$)
2016,2015,2014,2013,2012,2011,2010,2009,2008,2007,2006,2005,2004,2003,2002,2001,2000,1999,1998,1997,1996,1995,1994,1993,1992,1991,1990,1989,1988,1987,1986,1985,1984,1983,1982,1981,1980,1979,1978,1977,1976,1975,1974,1973,1972,1971,1970,1969,1968,1967,1966,1965,1964,1963,1962,1961
Estas estadísticas en otros países:
AfghanistanAlbaniaAlgeriaAmerican SamoaAngolaAntigua and BarbudaArab WorldArgentinaArmeniaArubaAustraliaAustriaAzerbaijanBahamas, TheBahrainBangladeshBarbadosBelarusBelgiumBelizeBeninBermudaBhutanBoliviaBosnia and HerzegovinaBotswanaBrazilBrunei DarussalamBulgariaBurkina FasoBurundiCabo VerdeCambodiaCameroonCanadaCaribbean small statesCentral African RepublicCentral Europe and the BalticsChadChileChinaColombiaComorosCongo, Dem. Rep.Congo, Rep.Costa RicaCote d'IvoireCroatiaCubaCuracaoCyprusCzech RepublicDenmarkDjiboutiDominicaDominican RepublicEarly-demographic dividendEast Asia & PacificEast Asia & Pacific (excluding high income)East Asia & Pacific (IDA & IBRD countries)EcuadorEgypt, Arab Rep.El SalvadorEquatorial GuineaEritreaEstoniaEthiopiaEuro areaEurope & Central AsiaEurope & Central Asia (excluding high income)Europe & Central Asia (IDA & IBRD countries)European UnionFaroe IslandsFijiFinlandFragile and conflict affected situationsFranceFrench PolynesiaGabonGambia, TheGeorgiaGermanyGhanaGreeceGreenlandGrenadaGuatemalaGuineaGuinea-BissauGuyanaHaitiHeavily indebted poor countries (HIPC)High incomeHondurasHong Kong SAR, ChinaHungaryIBRD onlyIcelandIDA & IBRD totalIDA blendIDA onlyIDA totalIndiaIndonesiaIran, Islamic Rep.IraqIrelandIsraelItalyJamaicaJapanJordanKazakhstanKenyaKiribatiKorea, Dem. People’s Rep.Korea, Rep.KuwaitKyrgyz RepublicLao PDRLate-demographic dividendLatin America & Caribbean Latin America & Caribbean (excluding high income)Latin America & the Caribbean (IDA & IBRD countries)LatviaLeast developed countries: UN classificationLebanonLesothoLiberiaLibyaLithuaniaLow & middle incomeLow incomeLower middle incomeLuxembourgMacao SAR, ChinaMacedonia, FYRMadagascarMalawiMalaysiaMaldivesMaliMaltaMarshall IslandsMauritaniaMauritiusMexicoMicronesia, Fed. Sts.Middle East & North AfricaMiddle East & North Africa (excluding high income)Middle East & North Africa (IDA & IBRD countries)Middle incomeMoldovaMongoliaMontenegroMoroccoMozambiqueMyanmarNamibiaNepalNetherlandsNew CaledoniaNew ZealandNicaraguaNigerNigeriaNorth AmericaNorthern Mariana IslandsNorwayOECD membersOmanOther small statesPacific island small statesPakistanPalauPanamaPapua New GuineaParaguayPeruPhilippinesPolandPortugalPost-demographic dividendPre-demographic dividendQatarRomaniaRussian FederationRwandaSamoaSao Tome and PrincipeSaudi ArabiaSenegalSerbiaSeychellesSierra LeoneSingaporeSint Maarten (Dutch part)Slovak RepublicSloveniaSmall statesSolomon IslandsSouth AfricaSouth AsiaSouth Asia (IDA & IBRD)SpainSri LankaSt. Kitts and NevisSt. LuciaSt. Martin (French part)St. Vincent and the GrenadinesSub-Saharan Africa Sub-Saharan Africa (excluding high income)Sub-Saharan Africa (IDA & IBRD countries)SudanSurinameSwazilandSwedenSwitzerlandSyrian Arab RepublicTajikistanTanzaniaThailandTimor-LesteTogoTongaTrinidad and TobagoTunisiaTurkeyTurkmenistanTuvaluUgandaUkraineUnited Arab EmiratesUnited KingdomUnited StatesUpper middle incomeUruguayUzbekistanVanuatuVenezuela, RBVietnamWorldYemen, Rep.ZambiaZimbabwe línea de tiempo (timeline):
En esta escala de tiempo se presenta un gráfico de 1961 y 2016 de IDA only. Los datos de 1960 están ausentes. El número de observaciones reales por fecha: 56.
Fuente (nombre):
Indicadores del desarrollo mundial
Fuente (organización):
World Trade Organization.
Categorías:
Private Sector, Trade
Se ha actualizado:
23 abr 2017 año
Los indicadores de los cambios de valor en los últimos años
Mínimo:
4.541 bn
1 ene 1961 año
Máximo:
324.701 bn
1 ene 2015 año
A la fecha de observación
Valor
Cambio absoluto
El cambio con respecto al valor anterior
1 ene 1961 año
4.541 bn
+4.541 bn
0.0%
1 ene 1962 año
4.707 bn
+165.722 millones
3.65%
1 ene 1963 año
4.668 bn
-39.086 millones
-0.83%
1 ene 1964 año
4.975 bn
+307.182 millones
6.58%
1 ene 1965 año
5.382 bn
+406.506 millones
8.17%
1 ene 1966 año
5.793 bn
+411.863 millones
7.65%
1 ene 1967 año
6.067 bn
+273.626 millones
4.72%
1 ene 1968 año
5.959 bn
-107.76 millones
-1.78%
1 ene 1969 año
6.305 bn
+345.818 millones
5.8%
1 ene 1970 año
6.779 bn
+473.753 millones
7.51%
1 ene 1971 año
7.499 bn
+720.035 millones
10.62%
1 ene 1972 año
8.293 bn
+794.241 millones
10.59%
1 ene 1973 año
8.566 bn
+272.508 millones
3.29%
1 ene 1974 año
10.876 bn
+2.311 bn
26.98%
1 ene 1975 año
15.633 bn
+4.757 bn
43.74%
1 ene 1976 año
17.636 bn
+2.003 bn
12.81%
1 ene 1977 año
18.022 bn
+385.744 millones
2.19%
1 ene 1978 año
21.989 bn
+3.967 bn
22.01%
1 ene 1979 año
25.549 bn
+3.56 bn
16.19%
1 ene 1980 año
28.896 bn
+3.347 bn
13.1%
1 ene 1981 año
38.712 bn
+9.817 bn
33.97%
1 ene 1982 año
38.714 bn
+1.072 millones
0.0%
1 ene 1983 año
34.671 bn
-4.043 bn
-10.44%
1 ene 1984 año
33.381 bn
-1.29 bn
-3.72%
1 ene 1985 año
32.266 bn
-1.115 bn
-3.34%
1 ene 1986 año
32.144 bn
-122.22 millones
-0.38%
1 ene 1987 año
30.927 bn
-1.217 bn
-3.79%
1 ene 1988 año
32.511 bn
+1.585 bn
5.12%
1 ene 1989 año
34.264 bn
+1.753 bn
5.39%
1 ene 1990 año
34.848 bn
+583.223 millones
1.7%
1 ene 1991 año
36.27 bn
+1.423 bn
4.08%
1 ene 1992 año
35.722 bn
-548.129 millones
-1.51%
1 ene 1993 año
39.932 bn
+4.209 bn
11.78%
1 ene 1994 año
41.588 bn
+1.657 bn
4.15%
1 ene 1995 año
43.889 bn
+2.3 bn
5.53%
1 ene 1996 año
51.712 bn
+7.824 bn
17.83%
1 ene 1997 año
55.774 bn
+4.062 bn
7.86%
1 ene 1998 año
56.152 bn
+377.484 millones
0.68%
1 ene 1999 año
58.896 bn
+2.744 bn
4.89%
1 ene 2000 año
60.614 bn
+1.718 bn
2.92%
1 ene 2001 año
62.366 bn
+1.752 bn
2.89%
1 ene 2002 año
66.966 bn
+4.6 bn
7.38%
1 ene 2003 año
69.049 bn
+2.083 bn
3.11%
1 ene 2004 año
80.614 bn
+11.565 bn
16.75%
1 ene 2005 año
100.297 bn
+19.683 bn
24.42%
1 ene 2006 año
122.771 bn
+22.474 bn
22.41%
1 ene 2007 año
141.775 bn
+19.004 bn
15.48%
1 ene 2008 año
172.371 bn
+30.596 bn
21.58%
1 ene 2009 año
216.604 bn
+44.234 bn
25.66%
1 ene 2010 año
191.618 bn
-24.986 bn
-11.54%
1 ene 2011 año
225.379 bn
+33.761 bn
17.62%
1 ene 2012 año
273.959 bn
+48.58 bn
21.55%
1 ene 2013 año
290.863 bn
+16.904 bn
6.17%
1 ene 2014 año
310.899 bn
+20.036 bn
6.89%
1 ene 2015 año
324.701 bn
+13.802 bn
4.44%
1 ene 2016 año
298.826 bn
-25.876 bn
-7.97%
Ranking de los países por los datos estadísticos actuales


Comentarios: