29
/es/
es
AIzaSyAYiBZKx7MnpbEhh9jyipgxe19OcubqV5w
April 1, 2024
139525
Germany
DEU
true
2
1
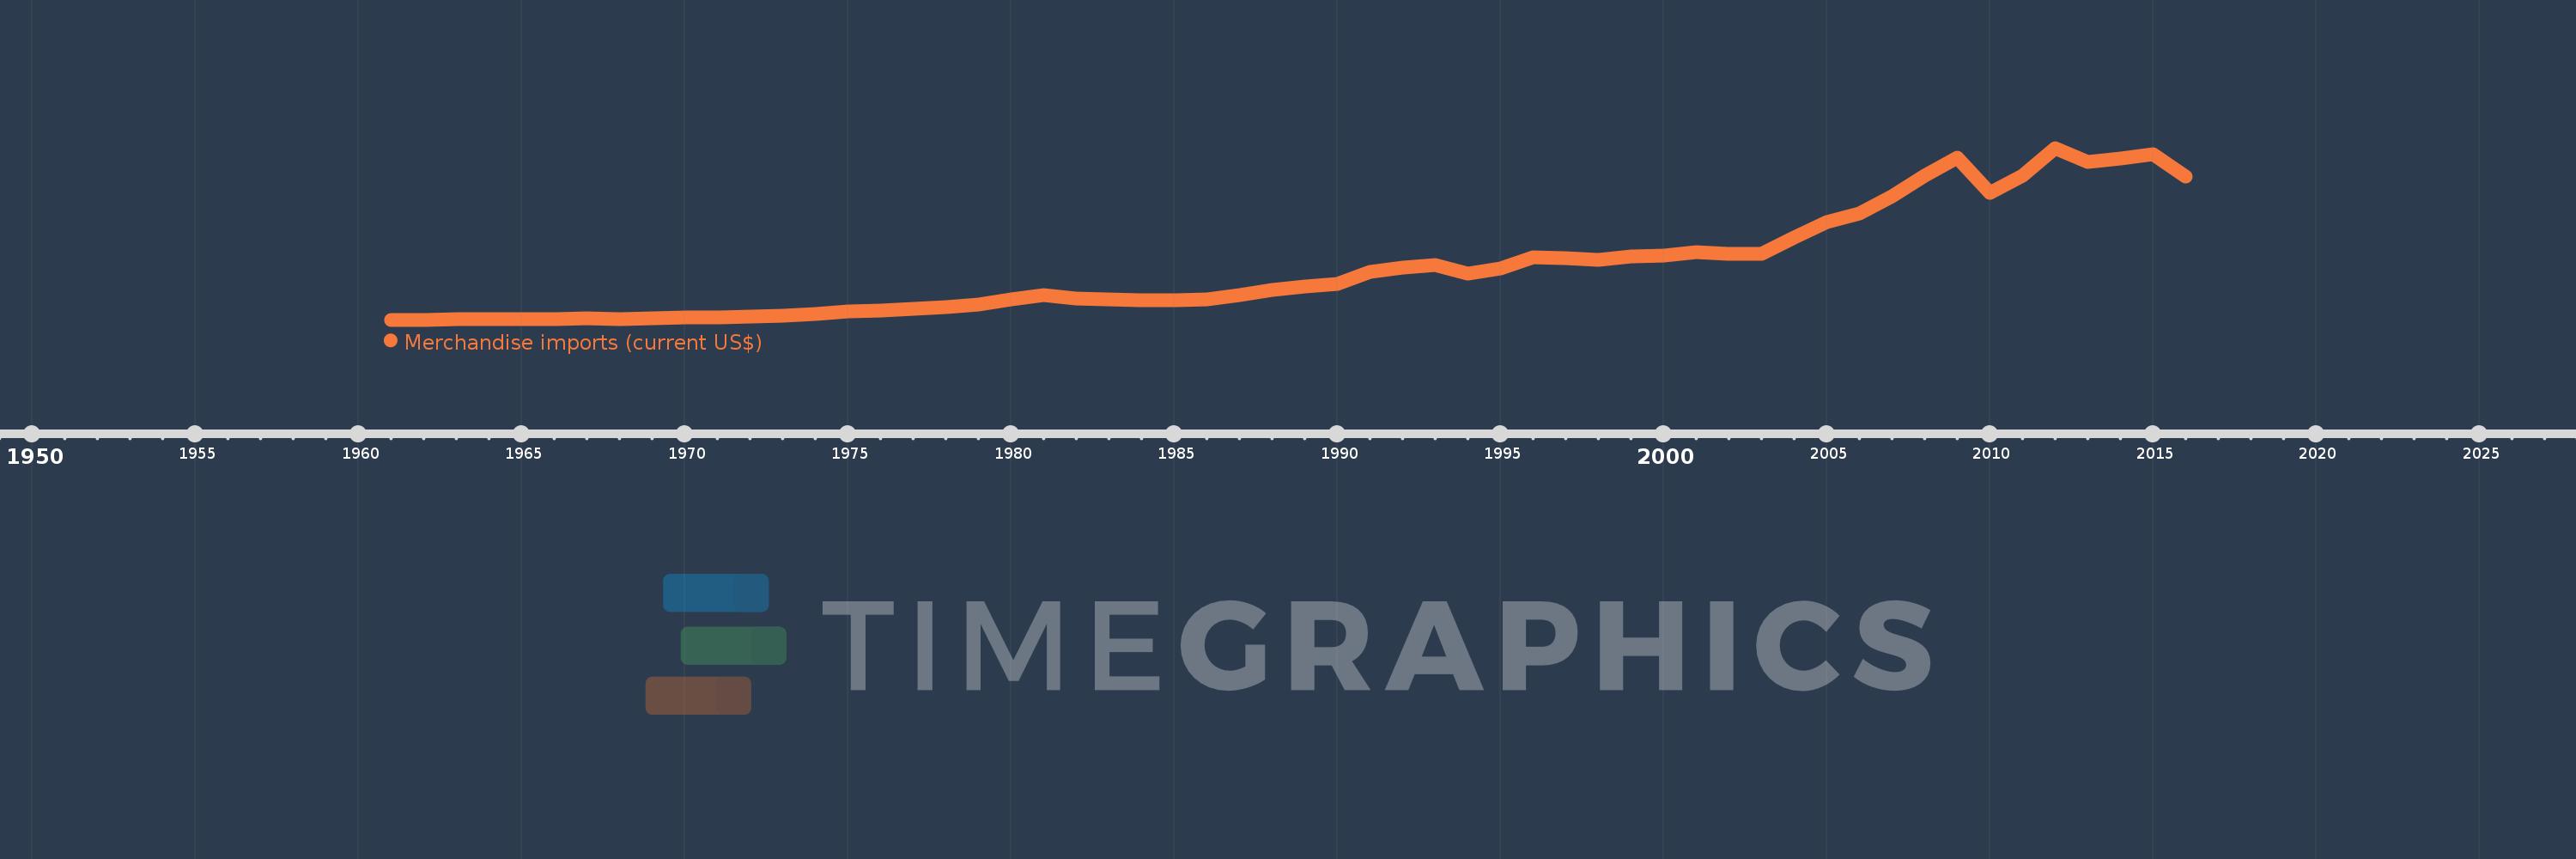
Merchandise imports (current US$)
2016,2015,2014,2013,2012,2011,2010,2009,2008,2007,2006,2005,2004,2003,2002,2001,2000,1999,1998,1997,1996,1995,1994,1993,1992,1991,1990,1989,1988,1987,1986,1985,1984,1983,1982,1981,1980,1979,1978,1977,1976,1975,1974,1973,1972,1971,1970,1969,1968,1967,1966,1965,1964,1963,1962,1961
Estas estadísticas en otros países:
AfghanistanAlbaniaAlgeriaAmerican SamoaAngolaAntigua and BarbudaArab WorldArgentinaArmeniaArubaAustraliaAustriaAzerbaijanBahamas, TheBahrainBangladeshBarbadosBelarusBelgiumBelizeBeninBermudaBhutanBoliviaBosnia and HerzegovinaBotswanaBrazilBrunei DarussalamBulgariaBurkina FasoBurundiCabo VerdeCambodiaCameroonCanadaCaribbean small statesCentral African RepublicCentral Europe and the BalticsChadChileChinaColombiaComorosCongo, Dem. Rep.Congo, Rep.Costa RicaCote d'IvoireCroatiaCubaCuracaoCyprusCzech RepublicDenmarkDjiboutiDominicaDominican RepublicEarly-demographic dividendEast Asia & PacificEast Asia & Pacific (excluding high income)East Asia & Pacific (IDA & IBRD countries)EcuadorEgypt, Arab Rep.El SalvadorEquatorial GuineaEritreaEstoniaEthiopiaEuro areaEurope & Central AsiaEurope & Central Asia (excluding high income)Europe & Central Asia (IDA & IBRD countries)European UnionFaroe IslandsFijiFinlandFragile and conflict affected situationsFranceFrench PolynesiaGabonGambia, TheGeorgiaGermanyGhanaGreeceGreenlandGrenadaGuatemalaGuineaGuinea-BissauGuyanaHaitiHeavily indebted poor countries (HIPC)High incomeHondurasHong Kong SAR, ChinaHungaryIBRD onlyIcelandIDA & IBRD totalIDA blendIDA onlyIDA totalIndiaIndonesiaIran, Islamic Rep.IraqIrelandIsraelItalyJamaicaJapanJordanKazakhstanKenyaKiribatiKorea, Dem. People’s Rep.Korea, Rep.KuwaitKyrgyz RepublicLao PDRLate-demographic dividendLatin America & Caribbean Latin America & Caribbean (excluding high income)Latin America & the Caribbean (IDA & IBRD countries)LatviaLeast developed countries: UN classificationLebanonLesothoLiberiaLibyaLithuaniaLow & middle incomeLow incomeLower middle incomeLuxembourgMacao SAR, ChinaMacedonia, FYRMadagascarMalawiMalaysiaMaldivesMaliMaltaMarshall IslandsMauritaniaMauritiusMexicoMicronesia, Fed. Sts.Middle East & North AfricaMiddle East & North Africa (excluding high income)Middle East & North Africa (IDA & IBRD countries)Middle incomeMoldovaMongoliaMontenegroMoroccoMozambiqueMyanmarNamibiaNepalNetherlandsNew CaledoniaNew ZealandNicaraguaNigerNigeriaNorth AmericaNorthern Mariana IslandsNorwayOECD membersOmanOther small statesPacific island small statesPakistanPalauPanamaPapua New GuineaParaguayPeruPhilippinesPolandPortugalPost-demographic dividendPre-demographic dividendQatarRomaniaRussian FederationRwandaSamoaSao Tome and PrincipeSaudi ArabiaSenegalSerbiaSeychellesSierra LeoneSingaporeSint Maarten (Dutch part)Slovak RepublicSloveniaSmall statesSolomon IslandsSouth AfricaSouth AsiaSouth Asia (IDA & IBRD)SpainSri LankaSt. Kitts and NevisSt. LuciaSt. Martin (French part)St. Vincent and the GrenadinesSub-Saharan Africa Sub-Saharan Africa (excluding high income)Sub-Saharan Africa (IDA & IBRD countries)SudanSurinameSwazilandSwedenSwitzerlandSyrian Arab RepublicTajikistanTanzaniaThailandTimor-LesteTogoTongaTrinidad and TobagoTunisiaTurkeyTurkmenistanTuvaluUgandaUkraineUnited Arab EmiratesUnited KingdomUnited StatesUpper middle incomeUruguayUzbekistanVanuatuVenezuela, RBVietnamWorldYemen, Rep.ZambiaZimbabwe línea de tiempo (timeline):
En esta escala de tiempo se presenta un gráfico de 1961 y 2016 de Germany. Los datos de 1960 están ausentes. El número de observaciones reales por fecha: 56.
Fuente (nombre):
Indicadores del desarrollo mundial
Fuente (organización):
World Trade Organization.
Categorías:
Private Sector, Trade
Se ha actualizado:
23 abr 2017 año
Los indicadores de los cambios de valor en los últimos años
Mínimo:
10.172 bn
1 ene 1961 año
Máximo:
1.255 billones
1 ene 2012 año
A la fecha de observación
Valor
Cambio absoluto
El cambio con respecto al valor anterior
1 ene 1961 año
10.172 bn
+10.172 bn
0.0%
1 ene 1962 año
11.011 bn
+839.2 millones
8.25%
1 ene 1963 año
12.375 bn
+1.364 bn
12.38%
1 ene 1964 año
13.069 bn
+694.5 millones
5.61%
1 ene 1965 año
14.71 bn
+1.64 bn
12.55%
1 ene 1966 año
17.612 bn
+2.902 bn
19.73%
1 ene 1967 año
18.167 bn
+555.2 millones
3.15%
1 ene 1968 año
17.546 bn
-621.7 millones
-3.42%
1 ene 1969 año
20.295 bn
+2.749 bn
15.67%
1 ene 1970 año
24.876 bn
+4.581 bn
22.57%
1 ene 1971 año
29.947 bn
+5.072 bn
20.39%
1 ene 1972 año
34.293 bn
+4.346 bn
14.51%
1 ene 1973 año
40.378 bn
+6.085 bn
17.74%
1 ene 1974 año
54.891 bn
+14.512 bn
35.94%
1 ene 1975 año
69.661 bn
+14.771 bn
26.91%
1 ene 1976 año
74.93 bn
+5.269 bn
7.56%
1 ene 1977 año
88.421 bn
+13.491 bn
18.0%
1 ene 1978 año
101.458 bn
+13.037 bn
14.74%
1 ene 1979 año
121.754 bn
+20.296 bn
20.0%
1 ene 1980 año
159.646 bn
+37.892 bn
31.12%
1 ene 1981 año
188.002 bn
+28.356 bn
17.76%
1 ene 1982 año
163.941 bn
-24.061 bn
-12.8%
1 ene 1983 año
155.323 bn
-8.618 bn
-5.26%
1 ene 1984 año
152.877 bn
-2.446 bn
-1.57%
1 ene 1985 año
153.022 bn
+145.0 millones
0.09%
1 ene 1986 año
158.488 bn
+5.466 bn
3.57%
1 ene 1987 año
190.872 bn
+32.384 bn
20.43%
1 ene 1988 año
228.441 bn
+37.569 bn
19.68%
1 ene 1989 año
250.467 bn
+22.026 bn
9.64%
1 ene 1990 año
269.702 bn
+19.235 bn
7.68%
1 ene 1991 año
355.686 bn
+85.984 bn
31.88%
1 ene 1992 año
389.908 bn
+34.222 bn
9.62%
1 ene 1993 año
408.619 bn
+18.711 bn
4.8%
1 ene 1994 año
342.611 bn
-66.008 bn
-16.15%
1 ene 1995 año
381.388 bn
+38.777 bn
11.32%
1 ene 1996 año
463.872 bn
+82.484 bn
21.63%
1 ene 1997 año
459.098 bn
-4.774 bn
-1.03%
1 ene 1998 año
445.731 bn
-13.367 bn
-2.91%
1 ene 1999 año
471.474 bn
+25.743 bn
5.78%
1 ene 2000 año
474.047 bn
+2.573 bn
0.55%
1 ene 2001 año
497.197 bn
+23.151 bn
4.88%
1 ene 2002 año
486.119 bn
-11.078 bn
-2.23%
1 ene 2003 año
490.283 bn
+4.163 bn
0.86%
1 ene 2004 año
604.612 bn
+114.33 bn
23.32%
1 ene 2005 año
715.742 bn
+111.129 bn
18.38%
1 ene 2006 año
777.073 bn
+61.331 bn
8.57%
1 ene 2007 año
906.684 bn
+129.611 bn
16.68%
1 ene 2008 año
1.055 billones
+148.299 bn
16.36%
1 ene 2009 año
1.185 billones
+130.084 bn
12.33%
1 ene 2010 año
926.347 bn
-258.72 bn
-21.83%
1 ene 2011 año
1.055 billones
+128.467 bn
13.87%
1 ene 2012 año
1.255 billones
+200.055 bn
18.97%
1 ene 2013 año
1.155 billones
-100.018 bn
-7.97%
1 ene 2014 año
1.181 billones
+26.381 bn
2.28%
1 ene 2015 año
1.207 billones
+25.808 bn
2.18%
1 ene 2016 año
1.05 billones
-157.017 bn
-13.01%
Ranking de los países por los datos estadísticos actuales


Comentarios: