29
/es/
es
AIzaSyAYiBZKx7MnpbEhh9jyipgxe19OcubqV5w
April 1, 2024
245885
South Africa
ZAF
true
2
1
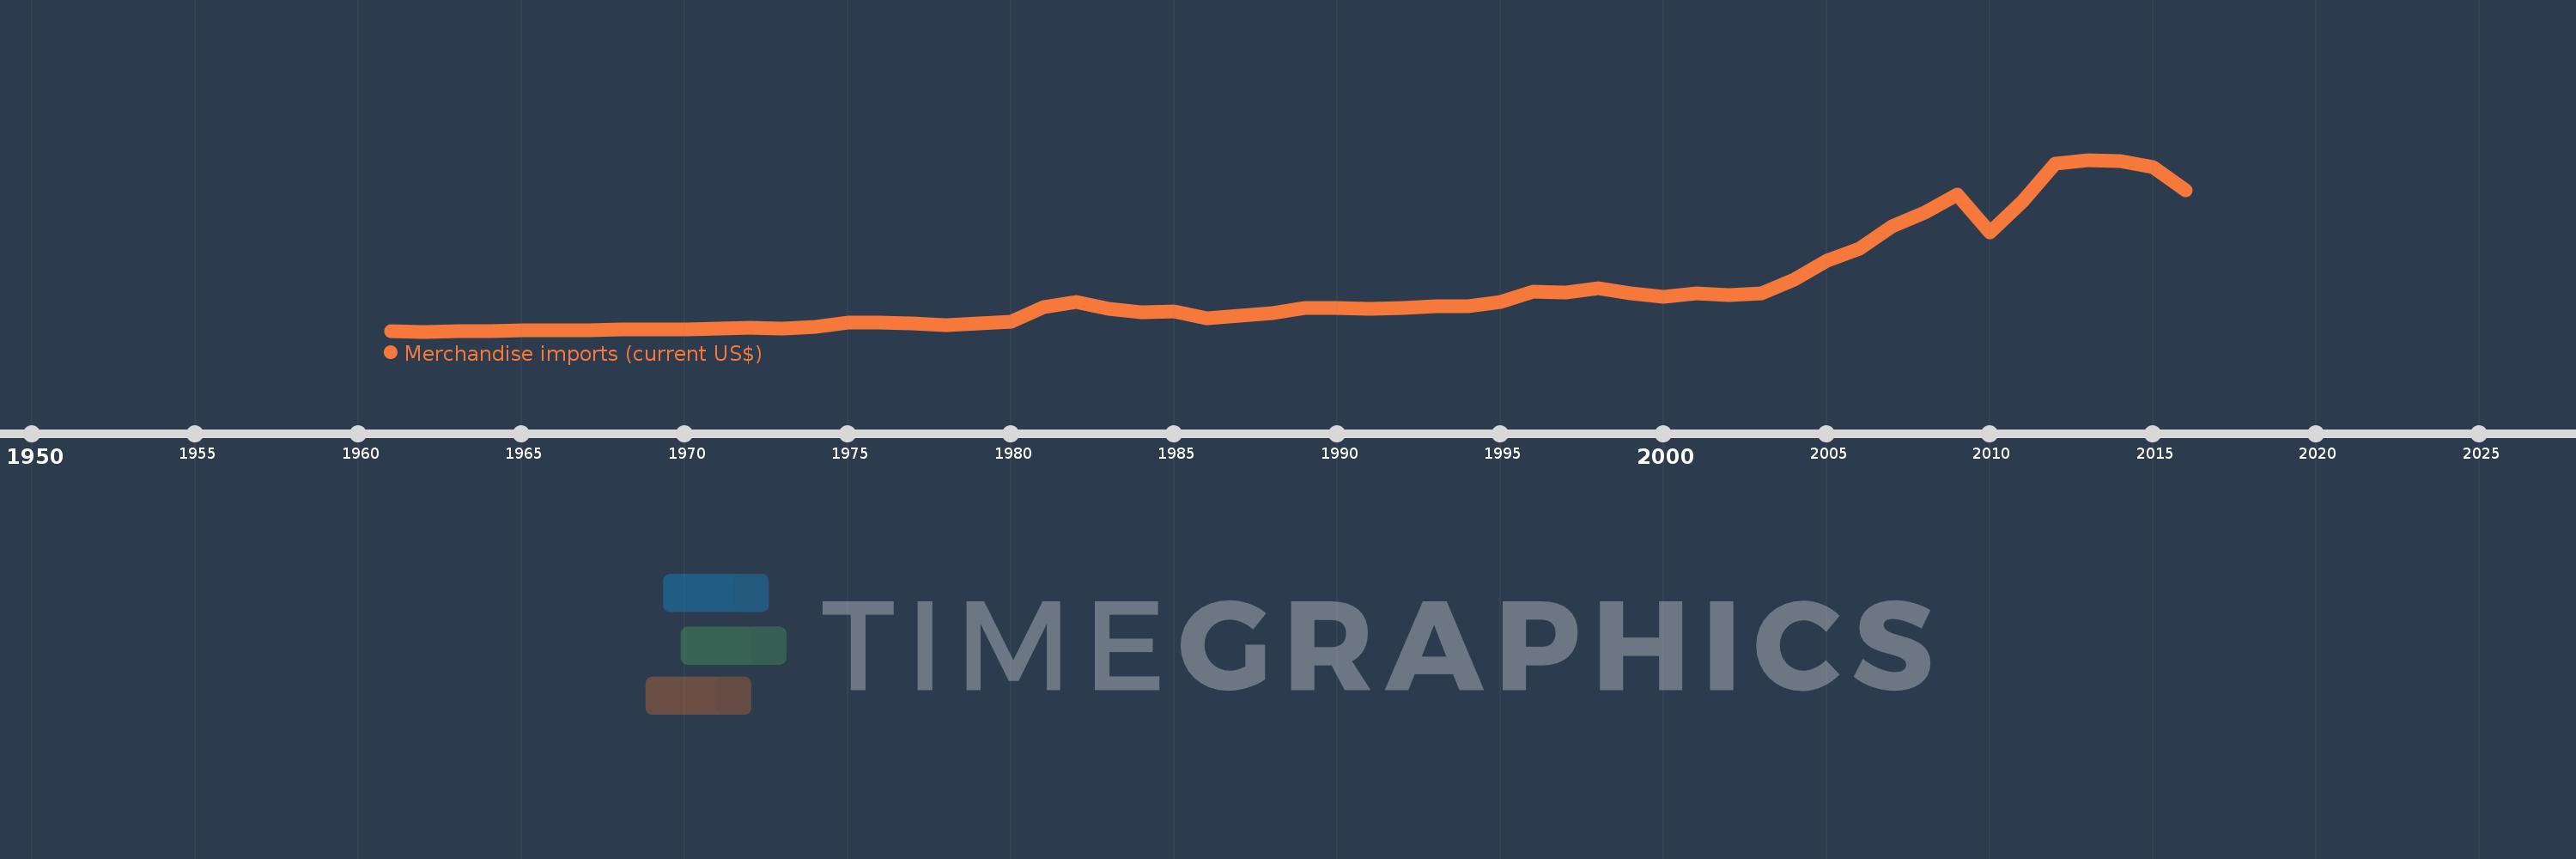
Merchandise imports (current US$)
2016,2015,2014,2013,2012,2011,2010,2009,2008,2007,2006,2005,2004,2003,2002,2001,2000,1999,1998,1997,1996,1995,1994,1993,1992,1991,1990,1989,1988,1987,1986,1985,1984,1983,1982,1981,1980,1979,1978,1977,1976,1975,1974,1973,1972,1971,1970,1969,1968,1967,1966,1965,1964,1963,1962,1961
Estas estadísticas en otros países:
AfghanistanAlbaniaAlgeriaAmerican SamoaAngolaAntigua and BarbudaArab WorldArgentinaArmeniaArubaAustraliaAustriaAzerbaijanBahamas, TheBahrainBangladeshBarbadosBelarusBelgiumBelizeBeninBermudaBhutanBoliviaBosnia and HerzegovinaBotswanaBrazilBrunei DarussalamBulgariaBurkina FasoBurundiCabo VerdeCambodiaCameroonCanadaCaribbean small statesCentral African RepublicCentral Europe and the BalticsChadChileChinaColombiaComorosCongo, Dem. Rep.Congo, Rep.Costa RicaCote d'IvoireCroatiaCubaCuracaoCyprusCzech RepublicDenmarkDjiboutiDominicaDominican RepublicEarly-demographic dividendEast Asia & PacificEast Asia & Pacific (excluding high income)East Asia & Pacific (IDA & IBRD countries)EcuadorEgypt, Arab Rep.El SalvadorEquatorial GuineaEritreaEstoniaEthiopiaEuro areaEurope & Central AsiaEurope & Central Asia (excluding high income)Europe & Central Asia (IDA & IBRD countries)European UnionFaroe IslandsFijiFinlandFragile and conflict affected situationsFranceFrench PolynesiaGabonGambia, TheGeorgiaGermanyGhanaGreeceGreenlandGrenadaGuatemalaGuineaGuinea-BissauGuyanaHaitiHeavily indebted poor countries (HIPC)High incomeHondurasHong Kong SAR, ChinaHungaryIBRD onlyIcelandIDA & IBRD totalIDA blendIDA onlyIDA totalIndiaIndonesiaIran, Islamic Rep.IraqIrelandIsraelItalyJamaicaJapanJordanKazakhstanKenyaKiribatiKorea, Dem. People’s Rep.Korea, Rep.KuwaitKyrgyz RepublicLao PDRLate-demographic dividendLatin America & Caribbean Latin America & Caribbean (excluding high income)Latin America & the Caribbean (IDA & IBRD countries)LatviaLeast developed countries: UN classificationLebanonLesothoLiberiaLibyaLithuaniaLow & middle incomeLow incomeLower middle incomeLuxembourgMacao SAR, ChinaMacedonia, FYRMadagascarMalawiMalaysiaMaldivesMaliMaltaMarshall IslandsMauritaniaMauritiusMexicoMicronesia, Fed. Sts.Middle East & North AfricaMiddle East & North Africa (excluding high income)Middle East & North Africa (IDA & IBRD countries)Middle incomeMoldovaMongoliaMontenegroMoroccoMozambiqueMyanmarNamibiaNepalNetherlandsNew CaledoniaNew ZealandNicaraguaNigerNigeriaNorth AmericaNorthern Mariana IslandsNorwayOECD membersOmanOther small statesPacific island small statesPakistanPalauPanamaPapua New GuineaParaguayPeruPhilippinesPolandPortugalPost-demographic dividendPre-demographic dividendQatarRomaniaRussian FederationRwandaSamoaSao Tome and PrincipeSaudi ArabiaSenegalSerbiaSeychellesSierra LeoneSingaporeSint Maarten (Dutch part)Slovak RepublicSloveniaSmall statesSolomon IslandsSouth AfricaSouth AsiaSouth Asia (IDA & IBRD)SpainSri LankaSt. Kitts and NevisSt. LuciaSt. Martin (French part)St. Vincent and the GrenadinesSub-Saharan Africa Sub-Saharan Africa (excluding high income)Sub-Saharan Africa (IDA & IBRD countries)SudanSurinameSwazilandSwedenSwitzerlandSyrian Arab RepublicTajikistanTanzaniaThailandTimor-LesteTogoTongaTrinidad and TobagoTunisiaTurkeyTurkmenistanTuvaluUgandaUkraineUnited Arab EmiratesUnited KingdomUnited StatesUpper middle incomeUruguayUzbekistanVanuatuVenezuela, RBVietnamWorldYemen, Rep.ZambiaZimbabwe línea de tiempo (timeline):
En esta escala de tiempo se presenta un gráfico de 1961 y 2016 de South Africa. Los datos de 1960 están ausentes. El número de observaciones reales por fecha: 56.
Fuente (nombre):
Indicadores del desarrollo mundial
Fuente (organización):
World Trade Organization.
Categorías:
Private Sector, Trade
Se ha actualizado:
23 abr 2017 año
Los indicadores de los cambios de valor en los últimos años
Mínimo:
1.46 bn
1 ene 1962 año
Máximo:
127.154 bn
1 ene 2013 año
A la fecha de observación
Valor
Cambio absoluto
El cambio con respecto al valor anterior
1 ene 1961 año
1.629 bn
+1.629 bn
0.0%
1 ene 1962 año
1.46 bn
-168.84 millones
-10.37%
1 ene 1963 año
1.476 bn
+16.52 millones
1.13%
1 ene 1964 año
1.771 bn
+294.84 millones
19.97%
1 ene 1965 año
2.281 bn
+509.74 millones
28.78%
1 ene 1966 año
2.563 bn
+281.96 millones
12.36%
1 ene 1967 año
2.395 bn
-167.86 millones
-6.55%
1 ene 1968 año
2.78 bn
+385.0 millones
16.07%
1 ene 1969 año
2.789 bn
+9.1 millones
0.33%
1 ene 1970 año
3.189 bn
+399.98 millones
14.34%
1 ene 1971 año
3.843 bn
+653.94 millones
20.5%
1 ene 1972 año
4.364 bn
+520.58 millones
13.55%
1 ene 1973 año
3.948 bn
-416.15 millones
-9.54%
1 ene 1974 año
5.163 bn
+1.216 bn
30.8%
1 ene 1975 año
7.856 bn
+2.693 bn
52.15%
1 ene 1976 año
8.293 bn
+436.73 millones
5.56%
1 ene 1977 año
7.285 bn
-1.008 bn
-12.16%
1 ene 1978 año
6.27 bn
-1.015 bn
-13.93%
1 ene 1979 año
7.615 bn
+1.345 bn
21.44%
1 ene 1980 año
8.989 bn
+1.374 bn
18.04%
1 ene 1981 año
19.598 bn
+10.609 bn
118.03%
1 ene 1982 año
22.925 bn
+3.327 bn
16.98%
1 ene 1983 año
18.407 bn
-4.518 bn
-19.71%
1 ene 1984 año
15.813 bn
-2.594 bn
-14.09%
1 ene 1985 año
15.955 bn
+142.0 millones
0.9%
1 ene 1986 año
11.319 bn
-4.636 bn
-29.06%
1 ene 1987 año
12.992 bn
+1.673 bn
14.78%
1 ene 1988 año
15.277 bn
+2.285 bn
17.59%
1 ene 1989 año
18.723 bn
+3.446 bn
22.56%
1 ene 1990 año
18.498 bn
-225.0 millones
-1.2%
1 ene 1991 año
18.399 bn
-99.0 millones
-0.54%
1 ene 1992 año
18.829 bn
+430.0 millones
2.34%
1 ene 1993 año
19.738 bn
+909.0 millones
4.83%
1 ene 1994 año
19.991 bn
+253.0 millones
1.28%
1 ene 1995 año
23.363 bn
+3.372 bn
16.87%
1 ene 1996 año
30.546 bn
+7.183 bn
30.75%
1 ene 1997 año
30.182 bn
-364.0 millones
-1.19%
1 ene 1998 año
32.998 bn
+2.816 bn
9.33%
1 ene 1999 año
29.242 bn
-3.756 bn
-11.38%
1 ene 2000 año
26.696 bn
-2.546 bn
-8.71%
1 ene 2001 año
29.695 bn
+2.999 bn
11.23%
1 ene 2002 año
28.248 bn
-1.447 bn
-4.87%
1 ene 2003 año
29.267 bn
+1.019 bn
3.61%
1 ene 2004 año
39.748 bn
+10.481 bn
35.81%
1 ene 2005 año
53.466 bn
+13.718 bn
34.51%
1 ene 2006 año
62.304 bn
+8.838 bn
16.53%
1 ene 2007 año
78.715 bn
+16.41 bn
26.34%
1 ene 2008 año
88.45 bn
+9.735 bn
12.37%
1 ene 2009 año
101.64 bn
+13.19 bn
14.91%
1 ene 2010 año
74.053 bn
-27.587 bn
-27.14%
1 ene 2011 año
96.835 bn
+22.782 bn
30.76%
1 ene 2012 año
124.43 bn
+27.595 bn
28.5%
1 ene 2013 año
127.154 bn
+2.724 bn
2.19%
1 ene 2014 año
126.359 bn
-794.739 millones
-0.63%
1 ene 2015 año
121.965 bn
-4.394 bn
-3.48%
1 ene 2016 año
104.62 bn
-17.345 bn
-14.22%
Ranking de los países por los datos estadísticos actuales


Comentarios: