29
/es/
es
AIzaSyAYiBZKx7MnpbEhh9jyipgxe19OcubqV5w
April 1, 2024
228774
Romania
ROU
true
2
1
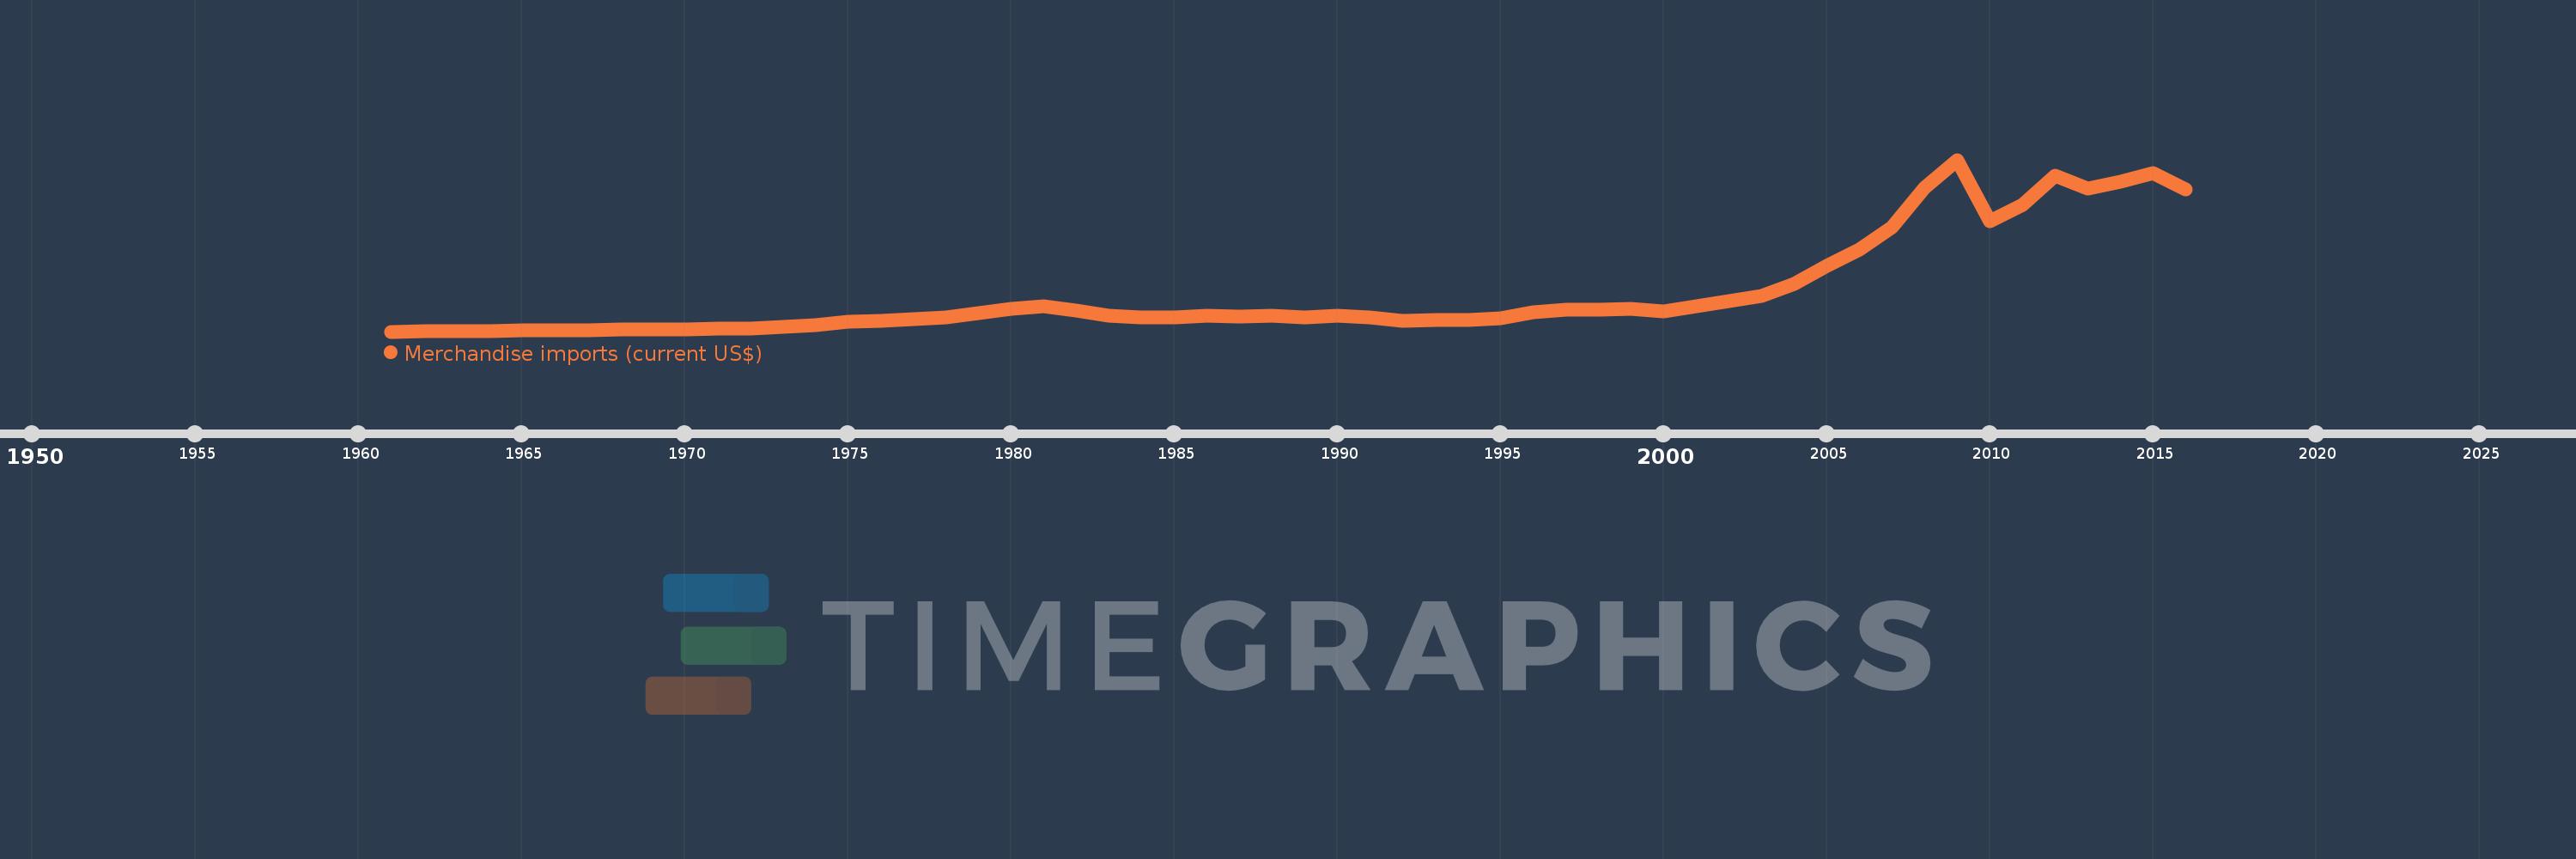
Merchandise imports (current US$)
2016,2015,2014,2013,2012,2011,2010,2009,2008,2007,2006,2005,2004,2003,2002,2001,2000,1999,1998,1997,1996,1995,1994,1993,1992,1991,1990,1989,1988,1987,1986,1985,1984,1983,1982,1981,1980,1979,1978,1977,1976,1975,1974,1973,1972,1971,1970,1969,1968,1967,1966,1965,1964,1963,1962,1961
Estas estadísticas en otros países:
AfghanistanAlbaniaAlgeriaAmerican SamoaAngolaAntigua and BarbudaArab WorldArgentinaArmeniaArubaAustraliaAustriaAzerbaijanBahamas, TheBahrainBangladeshBarbadosBelarusBelgiumBelizeBeninBermudaBhutanBoliviaBosnia and HerzegovinaBotswanaBrazilBrunei DarussalamBulgariaBurkina FasoBurundiCabo VerdeCambodiaCameroonCanadaCaribbean small statesCentral African RepublicCentral Europe and the BalticsChadChileChinaColombiaComorosCongo, Dem. Rep.Congo, Rep.Costa RicaCote d'IvoireCroatiaCubaCuracaoCyprusCzech RepublicDenmarkDjiboutiDominicaDominican RepublicEarly-demographic dividendEast Asia & PacificEast Asia & Pacific (excluding high income)East Asia & Pacific (IDA & IBRD countries)EcuadorEgypt, Arab Rep.El SalvadorEquatorial GuineaEritreaEstoniaEthiopiaEuro areaEurope & Central AsiaEurope & Central Asia (excluding high income)Europe & Central Asia (IDA & IBRD countries)European UnionFaroe IslandsFijiFinlandFragile and conflict affected situationsFranceFrench PolynesiaGabonGambia, TheGeorgiaGermanyGhanaGreeceGreenlandGrenadaGuatemalaGuineaGuinea-BissauGuyanaHaitiHeavily indebted poor countries (HIPC)High incomeHondurasHong Kong SAR, ChinaHungaryIBRD onlyIcelandIDA & IBRD totalIDA blendIDA onlyIDA totalIndiaIndonesiaIran, Islamic Rep.IraqIrelandIsraelItalyJamaicaJapanJordanKazakhstanKenyaKiribatiKorea, Dem. People’s Rep.Korea, Rep.KuwaitKyrgyz RepublicLao PDRLate-demographic dividendLatin America & Caribbean Latin America & Caribbean (excluding high income)Latin America & the Caribbean (IDA & IBRD countries)LatviaLeast developed countries: UN classificationLebanonLesothoLiberiaLibyaLithuaniaLow & middle incomeLow incomeLower middle incomeLuxembourgMacao SAR, ChinaMacedonia, FYRMadagascarMalawiMalaysiaMaldivesMaliMaltaMarshall IslandsMauritaniaMauritiusMexicoMicronesia, Fed. Sts.Middle East & North AfricaMiddle East & North Africa (excluding high income)Middle East & North Africa (IDA & IBRD countries)Middle incomeMoldovaMongoliaMontenegroMoroccoMozambiqueMyanmarNamibiaNepalNetherlandsNew CaledoniaNew ZealandNicaraguaNigerNigeriaNorth AmericaNorthern Mariana IslandsNorwayOECD membersOmanOther small statesPacific island small statesPakistanPalauPanamaPapua New GuineaParaguayPeruPhilippinesPolandPortugalPost-demographic dividendPre-demographic dividendQatarRomaniaRussian FederationRwandaSamoaSao Tome and PrincipeSaudi ArabiaSenegalSerbiaSeychellesSierra LeoneSingaporeSint Maarten (Dutch part)Slovak RepublicSloveniaSmall statesSolomon IslandsSouth AfricaSouth AsiaSouth Asia (IDA & IBRD)SpainSri LankaSt. Kitts and NevisSt. LuciaSt. Martin (French part)St. Vincent and the GrenadinesSub-Saharan Africa Sub-Saharan Africa (excluding high income)Sub-Saharan Africa (IDA & IBRD countries)SudanSurinameSwazilandSwedenSwitzerlandSyrian Arab RepublicTajikistanTanzaniaThailandTimor-LesteTogoTongaTrinidad and TobagoTunisiaTurkeyTurkmenistanTuvaluUgandaUkraineUnited Arab EmiratesUnited KingdomUnited StatesUpper middle incomeUruguayUzbekistanVanuatuVenezuela, RBVietnamWorldYemen, Rep.ZambiaZimbabwe línea de tiempo (timeline):
En esta escala de tiempo se presenta un gráfico de 1961 y 2016 de Romania. Los datos de 1960 están ausentes. El número de observaciones reales por fecha: 56.
Fuente (nombre):
Indicadores del desarrollo mundial
Fuente (organización):
World Trade Organization.
Categorías:
Private Sector, Trade
Se ha actualizado:
23 abr 2017 año
Los indicadores de los cambios de valor en los últimos años
Mínimo:
699.7 millones
1 ene 1961 año
Máximo:
84.053 bn
1 ene 2009 año
A la fecha de observación
Valor
Cambio absoluto
El cambio con respecto al valor anterior
1 ene 1961 año
699.7 millones
+699.7 millones
0.0%
1 ene 1962 año
879.8 millones
+180.1 millones
25.74%
1 ene 1963 año
1.016 bn
+136.5 millones
15.51%
1 ene 1964 año
1.104 bn
+87.5 millones
8.61%
1 ene 1965 año
1.262 bn
+157.8 millones
14.3%
1 ene 1966 año
1.163 bn
-98.3 millones
-7.79%
1 ene 1967 año
1.31 bn
+146.9 millones
12.63%
1 ene 1968 año
1.67 bn
+359.7 millones
27.45%
1 ene 1969 año
1.738 bn
+67.8 millones
4.06%
1 ene 1970 año
1.88 bn
+142.0 millones
8.17%
1 ene 1971 año
2.117 bn
+237.3 millones
12.62%
1 ene 1972 año
2.278 bn
+160.7 millones
7.59%
1 ene 1973 año
2.827 bn
+549.3 millones
24.12%
1 ene 1974 año
3.738 bn
+910.74 millones
32.22%
1 ene 1975 año
5.555 bn
+1.817 bn
48.62%
1 ene 1976 año
5.769 bn
+214.05 millones
3.85%
1 ene 1977 año
6.583 bn
+814.0 millones
14.11%
1 ene 1978 año
7.579 bn
+996.35 millones
15.14%
1 ene 1979 año
9.638 bn
+2.059 bn
27.16%
1 ene 1980 año
11.789 bn
+2.151 bn
22.31%
1 ene 1981 año
13.2 bn
+1.411 bn
11.97%
1 ene 1982 año
10.98 bn
-2.22 bn
-16.82%
1 ene 1983 año
8.32 bn
-2.66 bn
-24.23%
1 ene 1984 año
7.64 bn
-680.0 millones
-8.17%
1 ene 1985 año
7.56 bn
-80.0 millones
-1.05%
1 ene 1986 año
8.4 bn
+840.0 millones
11.11%
1 ene 1987 año
8.08 bn
-320.0 millones
-3.81%
1 ene 1988 año
8.31 bn
+230.0 millones
2.85%
1 ene 1989 año
7.64 bn
-670.0 millones
-8.06%
1 ene 1990 año
8.435 bn
+795.0 millones
10.41%
1 ene 1991 año
7.6 bn
-835.0 millones
-9.9%
1 ene 1992 año
5.793 bn
-1.807 bn
-23.78%
1 ene 1993 año
6.26 bn
+467.0 millones
8.06%
1 ene 1994 año
6.522 bn
+262.0 millones
4.19%
1 ene 1995 año
7.109 bn
+587.0 millones
9.0%
1 ene 1996 año
10.278 bn
+3.169 bn
44.58%
1 ene 1997 año
11.435 bn
+1.157 bn
11.26%
1 ene 1998 año
11.28 bn
-155.0 millones
-1.36%
1 ene 1999 año
11.821 bn
+541.0 millones
4.8%
1 ene 2000 año
10.417 bn
-1.404 bn
-11.88%
1 ene 2001 año
13.148 bn
+2.731 bn
26.22%
1 ene 2002 año
15.568 bn
+2.421 bn
18.41%
1 ene 2003 año
17.854 bn
+2.285 bn
14.68%
1 ene 2004 año
23.983 bn
+6.129 bn
34.33%
1 ene 2005 año
32.691 bn
+8.708 bn
36.31%
1 ene 2006 año
40.518 bn
+7.828 bn
23.95%
1 ene 2007 año
51.16 bn
+10.642 bn
26.26%
1 ene 2008 año
70.314 bn
+19.153 bn
37.44%
1 ene 2009 año
84.053 bn
+13.74 bn
19.54%
1 ene 2010 año
54.324 bn
-29.729 bn
-35.37%
1 ene 2011 año
62.109 bn
+7.785 bn
14.33%
1 ene 2012 año
76.48 bn
+14.372 bn
23.14%
1 ene 2013 año
70.207 bn
-6.274 bn
-8.2%
1 ene 2014 año
73.481 bn
+3.274 bn
4.66%
1 ene 2015 año
77.79 bn
+4.309 bn
5.86%
1 ene 2016 año
69.867 bn
-7.923 bn
-10.18%
Ranking de los países por los datos estadísticos actuales


Comentarios: